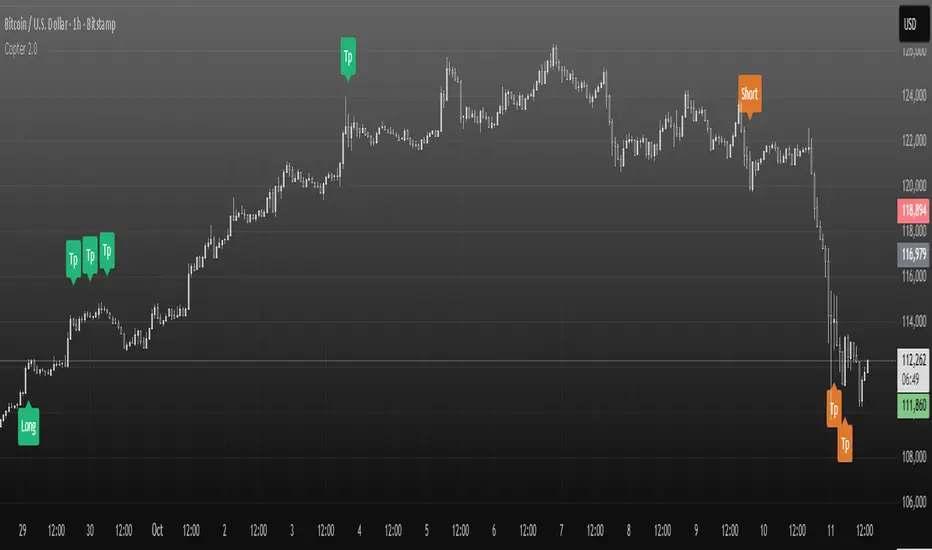
Copter 2.0💡 The indicator is designed for trading on any timeframe and includes a comprehensive system for determining entry and exit points based on technical analysis, price and volume.
📊 In the new version of Copter 2.0, the take profit and stop loss functions have been added
Let's analyze its key components:
✔️ Trend levels and extremes:
- The indicator determines local highs and lows for a certain period.
- the breakdown of these levels serves as a signal to open positions.
- the High-Low price dynamics analysis method is used to find key entry points.
✔️ Volumes:
-The indicator uses a configurable volume threshold to filter out candles with low volume and display only those with significant volume.
- the algorithm analyzes market data and sets an entry signal (opening a trade) and exit (profit taking/closing a position)
📍 Therefore, whether you are a beginner or an experienced trader, the indicator can help you stay ahead of the game and make more informed trading decisions.
📍 As a result, the trader can be sure that the signal is based on data analysis.
A long or short position can be stopped with either a profit or a small loss without prejudice to the potential profit.
✔️ Signal filtering:
- volume and volatile indicators are used to confirm the trend
- if a volume or volatility filter does not confirm the breakdown, the input signal is ignored
- analysis of moving averages of volumes and ATR is used
✔️ The use of the RSI in overbought and oversold analysis:
- the RSI indicator analyzes the strength of the current trend
- if the RSI exceeds 70, exit from a long position is possible
- if the RSI falls below 30, exit from a short position is possible
✔️ The use of EMA 20 and EMA 200
is additional moving average data that determines the current trend and the trend on higher timeframes.
- the main idea is that when they cross, we can see a change in trend movement and determine the general mood at the moment, based on which signals appear to open/close a deal.
- also, the indicator analyzes the past movement, thus determining the future direction
- based on the opening and closing of the past days, weeks, months.
✔️ Stop loss and risk management
- when entering a trade, a dynamic stop loss is set based on the percentage price change
- exit the position is carried out when a stop loss or a signal from the RSI is reached.
- it helps to minimize losses and protect profits
The market is unstable, and it is impossible to know what awaits it in the future.
The only way to manage risk is to limit the loss by setting a stop loss at 1% - 2% of the entry point.
It is recommended to set the profit in the ratio 1:1, 1:2,1:3, with partial fixation of 40%, 30%, 30% or wait for the indicator signal (TP)
We recommend fixing positions in parts. There will be a signal in the opposite direction when the volume is released.
To match the risk of the transaction, we recommend that you do not enter with high leverage.
Trade only with the amount that you are willing to lose.
With increased volatility in the market and flat, the indicator can give many signals.
After a strong fall or growth, we recommend not to open positions, because the probability of a flat is high.
✔️ Visualization of entry and exit points
- Entry points (long and short) are graphically displayed. green - long, orange - short
- stop loss levels are marked for clarity of risk management
✔️Recommendations for working with the indicator!
Entry/exit is performed on the next candle after the candle with the signal (buy/sell)
All timeframes and any trading pairs are used (when selecting settings for each one)
The indicator combines several methods of technical analysis:
- work with support and resistance levels
- filtering of signals based on volumes and volatility
- Overbought and oversold analysis using the RSI
- automatic risk management through stop loss
This approach makes the indicator a useful tool for short-term trading and active scalping.
❗️ NO REPAINT ! ❗️
ابحث في النصوص البرمجية عن "stop loss"
15-Min RSI Scalper [SwissAlgo]15-Min RSI Scalper
Tracks RSI Momentum Loss and Gain to Generate Signals
-------------------------------------------------------
WHAT THIS INDICATOR CALCULATES
This indicator attempts to identify RSI directional changes (RSI momentum) using a step-by-step "ladder" method. It reads RSI(14) from the next higher timeframe relative to your chart. On a 15-minute chart, it uses 1-hour RSI. On a 5-minute chart, it uses 15-minute RSI, and so on.
How the ladder logic works:
The indicator doesn't track RSI all the time. It only starts tracking when RSI crosses into potentially extreme territory (these are called "events" in the code):
For sell signals : when RSI crosses above a dynamic upper threshold (typically between 60-80, calculated as the 90th percentile of recent RSI)
For buy signals : when RSI crosses below a dynamic lower threshold (typically between 20-40, calculated as the 10th percentile of recent RSI)
Once tracking begins, RSI movement is divided into 2-point steps (boxes). The indicator counts how many boxes RSI climbs or falls.
A signal generates only when:
RSI reverses direction by at least 2 boxes (4 RSI points) from its extreme
RSI holds that reversal for 3 consecutive confirmed bars
Example: Dynamic threshold is at 68. RSI crosses above 68 → tracking starts. RSI climbs to 76 (4 boxes up). Then it drops back to 72 and stays below that level for 3 bars → sell signal prints. The buy signal works the same way in reverse.
-------------------------------------------------------
SIGNAL GENERATION METHODOLOGY
Sell Signal (Red Triangle)
RSI crosses above a dynamic start level (calculated as the 90th percentile of the last 1000 bars, constrained between 60-80)
Indicator tracks upward progression in 2-point boxes
RSI reverses and drops below a boundary 2 boxes below the highest box reached
RSI remains below that boundary for 3 confirmed bars
Red triangle plots above price
Reset condition: RSI returns below 50
Buy Signal (Green Triangle)
RSI crosses below a dynamic start level (10th percentile of last 1000 bars, constrained between 20-40)
Indicator tracks downward progression in 2-point boxes
RSI reverses and rises above a boundary 2 boxes above the lowest box reached
RSI remains above that boundary for 3 confirmed bars
Green triangle plots below price
Reset condition: RSI returns above 50
-------------------------------------------------------
TECHNICAL PARAMETERS
All parameters are hardcoded:
RSI Period: 14
Box Size: 2 RSI points
Reversal Threshold: 2 boxes (4 RSI points)
Confirmation Period: 3 bars
Reset Level: RSI 50
Sell Start Range: 60-80 (dynamic)
Buy Start Range: 20-40 (dynamic)
Lookback for Percentile: 1000 bars
Note: Since the code is open source, users can modify these hardcoded values directly in the script to adjust sensitivity. For example, increasing the confirmation period from 3 to 5 bars will produce fewer but more conservative signals. Decreasing the box size from 2 to 1 will make the indicator more responsive to smaller RSI movements.
-------------------------------------------------------
KEY FEATURES
Automatic Higher Timeframe RSI
When applied to a 15-minute chart, the indicator automatically reads 1-hour RSI data. This is the next standard timeframe above 15 minutes in the indicator's logic.
Dynamic Adaptive Start Levels
Sell signals use the 90th percentile of RSI over the last 1000 bars, constrained between 60-80. Buy signals use the 10th percentile, constrained between 20-40. These thresholds recalculate on each bar based on recent data.
Ladder Box System
RSI movements are tracked in 2-point boxes. The indicator requires a 2-box reversal followed by 3 consecutive bars maintaining that reversal before generating a signal.
Dual Signal Output
Red down-triangles plot above price when the sell signal conditions are met. Green up-triangles plot below the price when buy signal conditions are met.
-------------------------------------------------------
REPAINTING
This indicator does not repaint. All calculations use "barstate.isconfirmed" to ensure signals appear only on closed bars. The request.security() call uses lookahead=barmerge.lookahead_off to prevent forward-looking bias.
-------------------------------------------------------
INTENDED CHART TIMEFRAME
This indicator is designed for use on 15-minute charts. The visual reminder table at the top of the chart indicates this requirement.
On a 15-minute chart:
RSI data comes from the 1-hour timeframe
Signals reflect 1-hour momentum shifts
3-bar confirmation equals 45 minutes of price action
Using it on other timeframes will change the higher timeframe RSI source and may produce different behavior.
-------------------------------------------------------
WHAT THIS INDICATOR DOES NOT DO
Does not predict future price movements
Does not provide entry or exit advice
Does not guarantee profitable trades
Does not replace comprehensive technical analysis
Does not account for fundamental factors, news events, or market structure
Does not adapt to all market conditions equally
-------------------------------------------------------
EDUCATIONAL USE
This indicator demonstrates one approach to momentum reversal detection using:
Multi-timeframe analysis
Adaptive thresholds via percentile calculation
Step-wise momentum tracking
Multi-bar confirmation logic
It is designed as a technical study, not a trading system. Signals represent calculated conditions based on RSI behavior, not trade recommendations. Always do your own analysis before taking market positions.
-------------------------------------------------------
RISK DISCLOSURE
Trading involves substantial risk of loss. This indicator:
Is for educational and informational purposes only
Does not constitute financial, investment, or trading advice
Should not be used as the sole basis for trading decisions
Has not been tested across all market conditions
May produce false signals, late signals, or no signals in certain conditions
Past performance of any indicator does not predict future results. Users must conduct their own analysis and risk assessment before making trading decisions. Always use proper risk management, including stop losses and position sizing appropriate to your account and risk tolerance.
MIT LICENSE
This code is open source and provided as-is without warranties of any kind. You may use, modify, and distribute it freely under the MIT License.

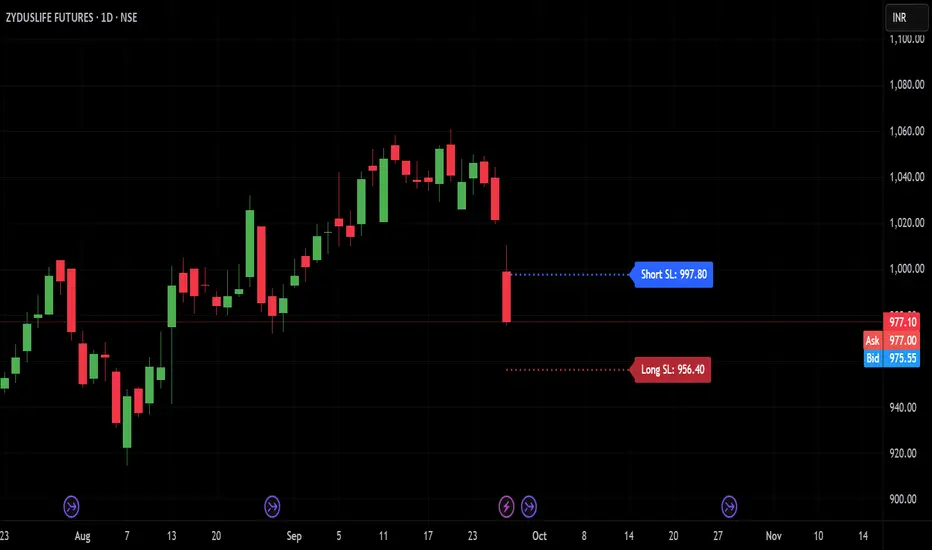
TRP Stop-Loss_Trailing SL# TRP Stop-Loss Indicator
## Overview
The TRP (True Range Percentage) Stop-Loss indicator is an advanced volatility-based stop-loss tool that provides dynamic position protection based on market volatility. Unlike traditional ATR-based indicators, TRP calculates volatility as a percentage of price, offering superior adaptability across different price ranges and market conditions.
## What is TRP and Why It's Superior to ATR
### TRP (True Range Percentage)
TRP calculates the true range as a percentage of the closing price, providing a **normalized volatility measure**. The formula is:
```
TRP = (True Range / Close) × 100
```
### Key Advantages of TRP over ATR:
1. **Price-Normalized Volatility**: TRP automatically adjusts for different price levels, making it equally effective whether you're trading a $10 stock or a $1000 stock.
2. **Percentage-Based Risk**: TRP gives you direct percentage risk values, making position sizing and risk management more intuitive.
3. **Better Cross-Market Comparison**: Unlike ATR, TRP allows you to compare volatility across different instruments on an equal basis.
4. **Adaptive to Market Conditions**: TRP naturally scales with price movements, providing more relevant stop-loss levels during trending markets.
5. **Consistent Risk Exposure**: Maintains consistent percentage risk regardless of the underlying asset's price level.
## Indicator Features
### 🎯 **Dual Stop-Loss System**
- **Long SL**: Red line below price for long positions
- **Short SL**: Blue line above price for short positions
- Independent control for each direction
### ⚙️ **Advanced Calculation Options**
#### **Multiple TRP Calculation Sources:**
- **Current Candle**: Uses real-time running candle data
- **Previous Close**: Uses completed candle data (default)
- **Last Green Candle**: For longs - uses TRP from the most recent bullish candle
- **Last Red Candle**: For shorts - uses TRP from the most recent bearish candle
#### **Independent Multipliers:**
- Separate multiplier controls for long and short stop-losses
- Adjust risk levels independently (0.1x to 10x+ range)
- Fine-tune stop-loss distance based on your risk tolerance
### 📊 **Visual Customization**
- **Line Styles**: Solid, dashed, or dotted lines
- **Custom Colors**: Separate color controls for long/short SL
- **Line Width**: Adjustable thickness (1-10)
- **Extension**: Customizable projection bars to the right
### 🏷️ **Smart Labeling System**
- **Value Display**: Shows exact SL price on the right side of lines
- **Toggle Control**: Enable/disable labels as needed
- **Size Options**: 5 different label sizes (tiny to huge)
- **Color Coordination**: Labels match their respective line colors
### ⏰ **Multi-Timeframe Support**
- Calculate TRP on any timeframe while viewing on another
- Default: Daily TRP calculation for intraday charts
- Maintains calculation integrity across timeframe switches
## How to Use
### Basic Setup:
1. Add the indicator to your chart
2. Select your preferred timeframe for TRP calculation
3. Choose calculation source for long and short positions
4. Adjust multipliers based on your risk tolerance
### Risk Management Applications:
- **Conservative**: Use 0.5-0.8 multipliers for tighter stops
- **Standard**: Use 1.0 multiplier for normal volatility-based stops
- **Aggressive**: Use 1.2-2.0 multipliers for wider stops in volatile markets
### Advanced Strategies:
- **Trend Following**: Use "Last Green/Red Candle" sources to adapt to momentum changes
- **Breakout Trading**: Use "Current Candle" for real-time stop adjustments
- **Swing Trading**: Use "Previous Close" for stable, confirmed levels
## Key Benefits
✅ **Dynamic Adaptation**: Automatically adjusts to changing market volatility
✅ **Percentage Risk Control**: Direct percentage-based risk management
✅ **Multi-Strategy Compatible**: Works with scalping, day trading, and swing trading
✅ **Visual Clarity**: Clean, professional chart display with customizable appearance
✅ **Real-Time Updates**: Instant recalculation when settings change
✅ **No Overlapping Lines**: Smart line management prevents chart clutter
## Best Practices
1. **Backtest First**: Test different multiplier settings on historical data
2. **Market Adaptation**: Adjust multipliers based on current market volatility regime
3. **Combine with Other Signals**: Use TRP stops with your existing entry signals
4. **Position Sizing**: Use TRP percentage values for consistent position sizing
5. **Regular Review**: Periodically review and adjust settings based on performance
## Technical Specifications
- **Pine Script Version**: v6
- **Overlay**: Yes (draws directly on price chart)
- **Calculations**: Based on 50-period EMA of TRP values
- **Updates**: Real-time with automatic line management
- **Performance**: Optimized for fast execution and minimal lag
This indicator is ideal for traders who want professional-grade, volatility-adaptive stop-loss management with the flexibility to fine-tune risk parameters across different market conditions and trading styles.
SP2L Pour Samadi Indicator [TradingFinder] Spike 2 Legs PA🔵 Introduction
The SP2L (Spike–2Leg) strategy, designed by Mohammad Ali Poursamadi, an international Iranian trader, is a simple yet powerful price action setup developed to identify precise entry points following sharp market movements.
A Spike refers to a sudden and rapid move in the market, usually triggered by a heavy flow of orders in one direction. This sharp movement creates an Imbalance between buyers and sellers. Since the market does not have time to trade evenly during such moves, it generates Inefficiency on the chart.
The direct result of a spike is usually the formation of a Fair Value Gap (FVG) — a space between candles indicating that trades were not distributed fairly. In simple terms, the spike is the cause, while Imbalance, Inefficiency, and FVG are its consequences.
🟣 How is a Spike formed?
Big Movement : A spike begins with a sharp and powerful move caused by heavy order flow in one direction.
Imbalance : This move disrupts the balance between buyers and sellers.
Inefficiency : Due to the speed of the move, the market fails to trade efficiently, leaving inefficiency on the chart.
Fair Value Gap (FVG) : The final outcome is a price gap between candles, highlighting unfair distribution of trades.
In SP2L, entries occur right after a spike. The entry logic is based on the structure of each candle’s Higher Lows (HLs) or Lower Highs (LHs).
When a spike occurs and candles consecutively form higher lows or lower highs :
In bullish conditions, each previous low becomes a potential Buy Entry.
In bearish conditions, each previous high becomes a potential Sell Entry.
🔵 How to Use
In the SP2L strategy, entries occur directly within the ongoing strong movement (the spike). A spike forms when heavy order flow pushes the market strongly in one direction, creating several large candles in sequence. This disrupts balance and leaves patterns such as Imbalance and FVG on the chart.
During such moves, the market does not necessarily retrace; instead, it continues strongly in the direction of the spike. The key principle in SP2L is that candles begin forming Higher Lows (HLs) in a bullish spike or Lower Highs (LHs) in a bearish spike. Each HL or LH acts as a potential entry level, but the actual entry only triggers once price returns to retest that level. This allows the trader to enter within a powerful wave while keeping stop-losses clear and risk controlled.
🟣 Bullish SP2L
When a bullish spike occurs, candles consecutively form Higher Lows. Each HL marks a potential entry. The entry is activated when price returns to that HL.
Stop-Loss (SL) : Placed below the candle where the spike originated, usually the lowest point before the sharp move.
Take-Profit (TP) : Defined based on classic risk-to-reward ratios, commonly TP1 = 1:1 and TP2 = 1:2. Stronger trends may allow extended targets.
🟣 Bearish SP2L
When a bearish spike occurs, candles consecutively form Lower Highs. Each LH marks a potential sell entry. The entry is triggered when price returns to retest that LH.
Stop-Loss (SL) : Placed above the candle where the bearish spike started, usually the highest point before the sharp drop.
Take-Profit (TP) : Similar to bullish setups, typically TP1 = 1:1 and TP2 = 1:2, with extended targets possible if bearish momentum continues.
🔵 Settings
🟣 Spike Filter | Movement
Minimum Spike Bars : Defines the minimum number of consecutive candles required for a valid spike.
Movement Power : Enables or disables the momentum-based spike filter.
Movement Power Level : Sets the strength threshold; higher values filter out weaker moves and only detect strong spikes.
🟣 Spike Filter | Gap
Gap Filter : Enables or disables the gap filter.
Gap Type : Selects which type of gap should be detected (All Gaps, Significant, Structural, Major).
🟣 Spike Filter | Doji
Doji Tolerance : Defines whether doji candles are allowed within a spike.
Max Doji Body Ratio : Maximum ratio of body-to-total candle size for classifying a candle as a doji.
Max Doji in Spike Ratio : Maximum percentage of doji candles allowed within a spike.
🟣 Trend Detection
Trend Detection : Enables or disables the trend detection module using dojis.
Max Doji Body Ratio : Maximum body-to-candle ratio used to classify a doji in trend calculations.
Candle Lookback : Number of candles used to calculate doji percentage for trend evaluation.
Max Doji in Trend Ratio : Maximum percentage of doji candles allowed within the lookback window for the trend to be valid.
🟣 Position Management
Stop-Loss Threshold : Enables or disables the stop-loss threshold feature.
Stop-Loss Threshold Value : Defines the value of the stop-loss threshold for risk management.
Risk-Reward Ratio : Sets the desired risk-to-reward ratio (e.g., 1:1 or 1:2).
Include SL Threshold in R:R : Determines whether the stop-loss threshold is included in risk-to-reward calculations.
🟣 Display Settings
Display Mode : Chooses between Setup (showing setups) or Signal (showing trade signals).
Only Display the Last Position : Displays only the most recent position on the chart when enabled.
🔵 Conclusion
The SP2L (Spike–2Leg) strategy, designed by Mohammad Ali Poursamadi, offers a simple yet effective framework for trading strong market flows. Built on the logic of spikes and candle structures (HLs and LHs), it identifies precise entry points directly within the main movement of the market, where risk is clear and reward is logical.
With transparent rules, defined stop-loss placement, and flexible risk management, SP2L proves especially effective in volatile markets such as forex, gold, and indices. Its simplicity makes it practical for both beginner traders and seasoned professionals.
In summary, SP2L helps traders avoid unnecessary complexity by focusing on spikes and consecutive HL/LH formations to capture accurate, low-risk entries.

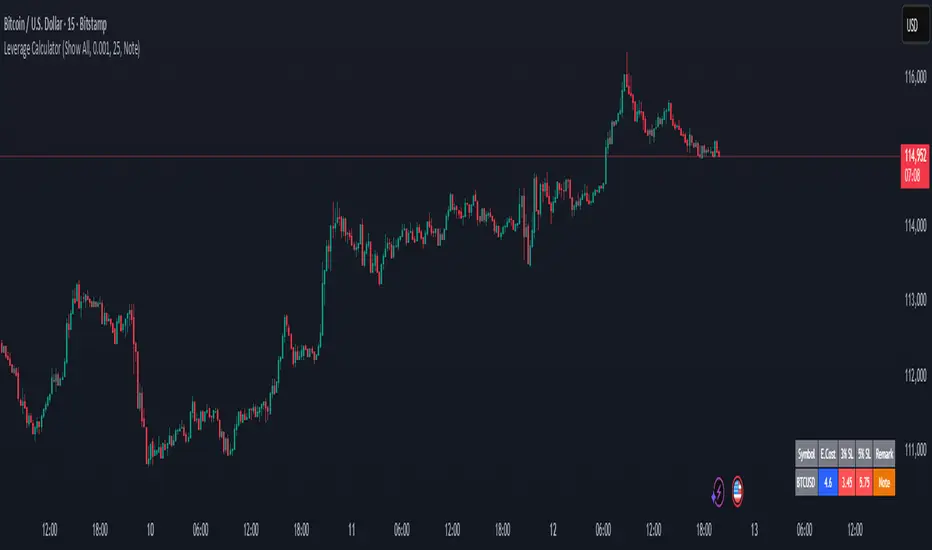
Margin Cost Calculator Screener - Taylor V1.2# Leverage Position Cost Calculator & Stop Lose Cost Screener #
Designed to provide traders with crucial insights into their leveraged positions directly on the TradingView chart.
Key Features:
> Dynamic Display: Choose to view only the estimated entry cost, or a comprehensive overview including potential losses at specific stop-loss levels, and a custom remark.
> Contract Size Input: Easily specify the contract size for your trades.
> Leverage Level Input: Set your desired leverage level, with helpful tooltips explaining the margin requirements for various leverage ratios (e.g., 25x, 10x, 5x) and an included fee estimate.
> Cost Calculation: Accurately calculates the estimated entry cost for your position based on the current market price, contract size, and leverage.
> Stop-Loss Projections: It projects potential losses for stop-loss orders set at 3% and 5% below the entry price, helping you manage risk effectively.
> Clear Table Visualization: All calculated data is presented in a clean, organized table anchored to the bottom-left of your chart, making it easy to reference at a glance.
> Symbol Identification: Automatically displays the short ticker symbol for the asset you are analyzing.
This tool is invaluable for traders who utilize leverage and need a quick, visual way to understand their financial exposure and potential outcomes before entering or managing a trade.
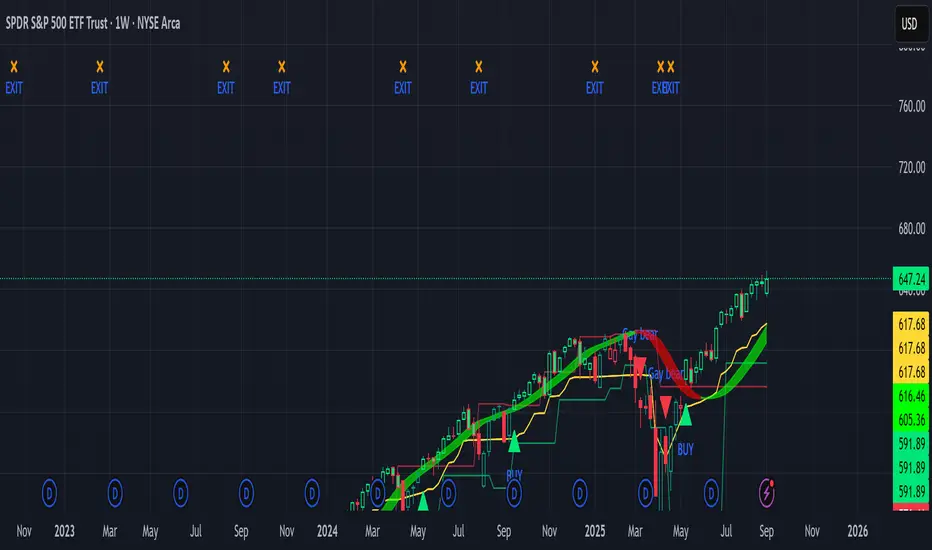
Sniper Swing — Short TF (Clean Signals) [v6]📘 How to Use the Sniper Swing Indicator
1. What It Does
It looks for short-term swing breaks in price.
It uses an oscillator (RSI/Stoch) and swing pivots to confirm moves.
It gives you 3 clear signals only:
BUY → Enter long (expecting price to go up).
Gay bear → Enter short (expecting price to go down).
EXIT → Close your trade (long or short).
Candles also change color:
Green = in a BUY trade.
Red = in a Gay bear trade.
Neutral (gray/none) = no trade.
2. When to Use
Works best on short timeframes (1m–5m) for scalping/intraday.
Use on liquid markets (MES/ES, NQ, SPY, BTC, ETH).
Avoid dead hours with no volume (like overnight futures lull or midday chop).
3. How to Trade With It
A. BUY trade
Wait for a BUY triangle below the candle.
Confirm:
Candle turned green.
Price broke a recent swing high.
Oscillator shows strength (indicator does this for you).
Enter long at the close of that candle.
Place your stop-loss:
At the yellow stop line (auto trailing stop), or
Just below the last swing low.
Stay in while candles are green.
Exit when:
An orange X appears, or
Price hits your stop.
B. Gay bear (short) trade
Wait for a Gay bear triangle above the candle.
Confirm:
Candle turned red.
Price broke a recent swing low.
Oscillator shows weakness.
Enter short at the close of that candle.
Place stop-loss:
At the yellow stop line, or
Just above the last swing high.
Stay in while candles are red.
Exit on an orange X or stop hit.
4. Pro Tips for New Traders
Only take one signal at a time → don’t double dip.
Quality > Quantity: ignore weak, sideways markets. Best signals happen during trends.
Start small: trade micros (MES) or small position sizes.
Use alerts: set TradingView alerts for BUY/Gay bear/EXIT so you don’t miss setups.
Think of the indicator like a navigator: it tells you the likely path, but you’re the driver → always manage risk.
5. Quick Mental Checklist
Signal? (BUY or Gay bear triangle)
Confirmed? (candle color + swing break)
Enter? (on close)
Stop? (yellow line or swing)
Exit? (orange X or stop)
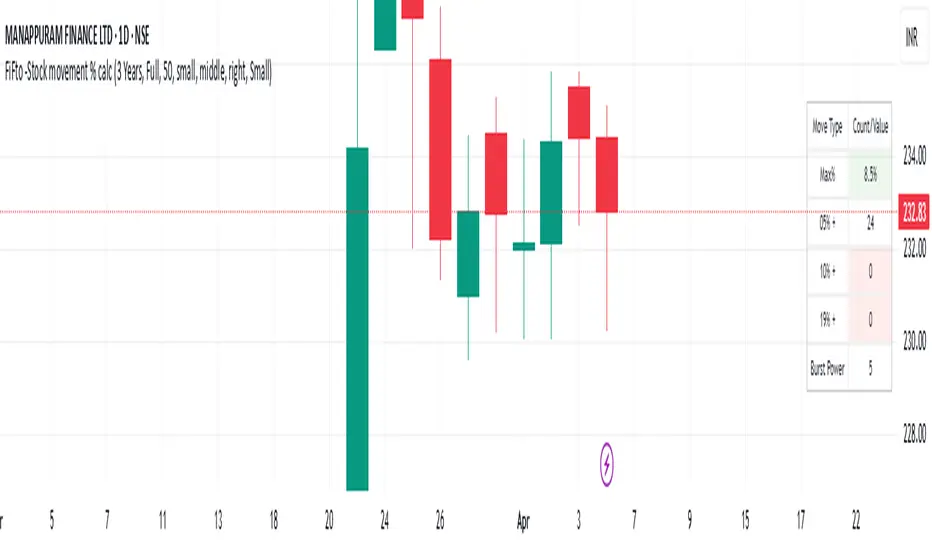
2ATR / Close %Certainly. Here is the English version of the indicator description you requested.
---
### **2ATR Stop-Loss Ratio**
This indicator provides a straightforward calculation of **what percentage a 2ATR (Average True Range) move represents relative to the current price**. It's a specialized tool designed to help traders set dynamic, volatility-based stop-loss levels.
---
### **Purpose of the Indicator**
Many traders use a **2ATR** as their standard for setting a stop-loss, believing it's a good measure of a stock's typical movement. However, it can be difficult to quickly determine the exact percentage a 2ATR drop represents from the current price. This indicator solves that problem by giving you a clear, single number that shows the **anticipated percentage loss before you even enter a position**.
---
### **How It Works**
The indicator is calculated using a simple formula:
**(2 * ATR(20) / Current Price) * 100**
* `ATR(20)`: The Average True Range over the last 20 periods. This period can be customized in the indicator's settings.
* `Current Price`: The closing price at the time of calculation.
---
### **How to Use It**
* **Assess Risk**: A higher number on the indicator means greater volatility, indicating a wider stop-loss range.
* **Set a Stop-Loss**: If the indicator shows **3%**, it means a 2ATR move is roughly a 3% change from the current price. This gives you a clear understanding of the potential loss.
* **Adjust Position Size**: If the potential percentage loss is larger than you're comfortable with, you can use this information to reduce your position size, effectively managing your risk.
This tool is especially useful for trading highly volatile stocks, as it helps you establish a clear and effective risk management strategy.

Position Size CalculatorPosition Size Calculator
This open-source Pine Script® indicator helps traders manage risk by calculating position size, margin, and risk/reward based on account size, leverage, entry, stop-loss, and take-profit. It features a customizable table and optional chart lines/labels for clear trade planning across stocks, forex, crypto, and futures.
What It Does
- Position Size: Computes units to trade based on risk percentage and stop-loss distance, capped by leverage.
- Margin: Calculates initial margin in base currency and USD, with account size percentage.
- Risk/Reward: Shows risk-reward ratio, percentage price movements, and USD gains/losses.
- Visualization: Displays results in a table and optional chart lines/labels with customizable styles.
How It Works
- Precision: Adjusts price formatting using syminfo.mintick for accuracy across assets.
- Calculations: Position size = accountSize * (riskPercent / 100) / |entry - stoploss|, capped by accountSize * leverage / entry. Margin = positionSize / leverage. Risk-reward = |takeprofit - entry| / |stoploss - entry|.
- Display: Table shows metrics; optional lines/labels plot entry, stop-loss, and take-profit with percentage and USD details.
How to Use
- Set Inputs:
1- Account Size (USD): Your capital (e.g., 1000).
2- % Risk per Trade: Risk tolerance (e.g., 1%).
3- Leverage: Broker leverage (e.g., 1x, 10x).
4- Entry, Stop Loss, Take Profit: Trade prices.
5- Show Lines and Labels: Enable chart overlays.
- Customize: Adjust table position, colors, and line styles (Solid, Dashed, Dotted).
- View Results: Table shows position size, margin, and risk/reward. Chart lines/labels (if enabled) display prices, percentages, and USD outcomes.
- Apply: Use metrics for trade execution; modify code for custom features.
Notes
- Ensure valid inputs (entry ≠ stop-loss, both positive) to avoid “N/A”.
- Open-source: Inspect or extend the code for your needs.
- Contact the author via TradingView for feedback.

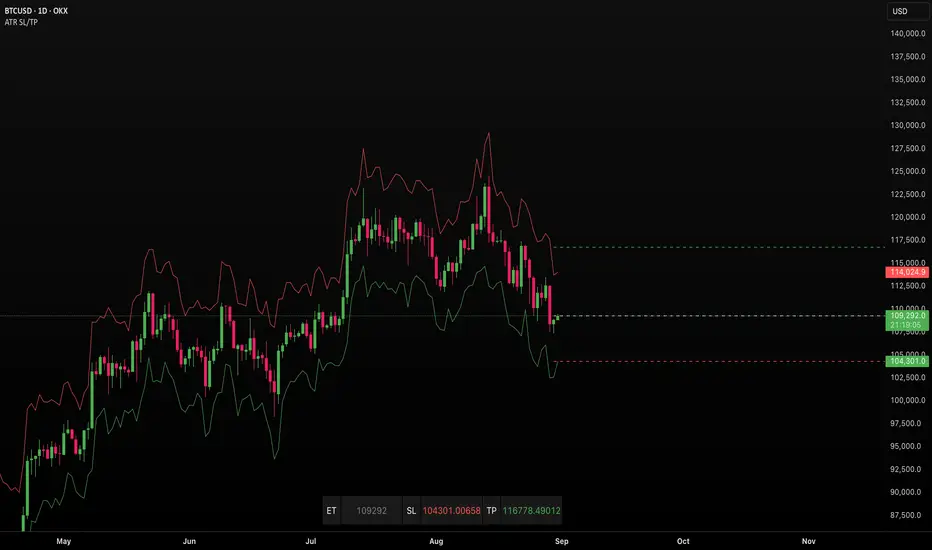
ATR SL/TPStop Loss Finder ATR
A Stop Loss Finder ATR indicator is a dynamic risk management tool leveraging the Average True Range (ATR) to identify and track optimal stop-loss levels based on current market volatility.
A stop hunt indicator is a technical tool designed to identify potential instances where large market participants, often referred to as "smart money," deliberately move the price to trigger a large number of stop-loss orders, creating a temporary price distortion before reversing the trend. These indicators aim to help traders detect these events to either avoid being stopped out or to enter trades in the direction of the anticipated reversal.
For example, a long wick below support with high volume may signal a bullish stop-hunt , indicating that the price has been driven down to trigger sell-stop orders before reversing upward. Conversely, a long wick above resistance with high volume may signal a bearish stop-hunt , suggesting the price was pushed up to trigger buy-stop orders before reversing downward. The presence of such wicks is often associated with candlestick patterns like hammers or shooting stars.
Unlike fixed stop-losses, this indicator adapts its distance from the current price using a customizable ATR multiplier, ensuring that stop-loss levels are neither too tight (prone to being triggered by normal market noise) nor too wide (exposing capital to excessive risk) . The core function calculates the true range—considering the current high-low range, gaps up, and gaps down—over a user-defined period (typically 14 bars), then applies a multiplier to generate a volatility-adjusted stop-loss distance . This approach allows the indicator to dynamically widen stops during high-volatility periods and tighten them during calm markets, providing a more responsive and context-aware exit strategy.
Extended CANSLIM Indicator❖ Extended CANSLIM Indicator.
The Extended CANSLIM indicator is an indicator that concentrates all the tools usually used by CANSLIM traders.
It shows a table where all the stock fundamental information is shown at once first for the last quarter and then up to 5 years back.
The fundamental data is checked against well known CANSLIM validation criteria and is shown over 4 state levels.
1. Good = Value is CANSLIM Compliant.
2. Acceptable = Value is not CANSLIM compliant but still good. value is shown with a lighter background color.
3. Warning = Value deserves special attention. Value is shown over orange background color.
3. Stop = Value is non CANSLIM compliant or indicates a stop trading condition. Value is shown over red background color.
The indicator has also a set of technical tools calculated on price or index and shown directly on the chart.
❖ Fundamental data shown in the table.
The table is arranged in 4 sets of data:
1. Table Header, showing Indicator and Company data.
2. CANSLIM.
3. 3Rs: RS Rating, Revenue and ROE.
4. Extra Data: Piotroski score, ATR, Trend Days, D to E, Avg Vol and Vol today.
Sets 3 and 4 can be hidden from the table.
❖ Indicator and Compay Data.
The table header shows, Indicator name and version.
It then displays Company Name, sector and industry, human size and its capitalization.
❖ CANSLIM Data.
Displays either genuine CANSLIM data from TradinView or custom data as best effort when that data cannot be obtained in TV.
C = EPS diluted growth, Quarterly YoY.
>= 25% = Good, >= 0% = Acceptable, < 0% = Stop
A = EPS diluted growth, Annual YoY.
>= 25% = Good, >= 0% = Acceptable, < 0% = Stop
N = New High as best effort (Cust).
Always Good
S = Float shares as best effort.
Always Good
L = One year performance relative to S&P 500 (Cust),
Positive : 0% .. 50% = Neutral, 50%+ = Leader, 80%+ = Leader+, 100%+ = Leader++
Negative : 0% .. -10% = Laggard, -10% .. -30% = Laggard+, -30%+ = Laggard++
>= 50% = Good, >= 0% = Acceptable, >= -10% Warning, < -10% = Stop
I = Accumulation/Distribution days over last 25 days as a clue for institutional support (Cust).
A delta is calculated by subtracting Distribution to Accumulation days.
> 0 = Good, = 0 = Acceptable, < 0 = Warning, < -5 = Stop
M = Market direction and exposure measured on S&500 closing between averages (Cust).
Varies from 0% Full Bear to 100% Full Bull
>= 80% = Good, >= 60% = Acceptable, >= 40% = Warning, < 40% = Stop
❖ Extra non CANSLIM Data.
RS = RS Rating.
>= 90 = Good, >= 80 = Accept, >= 50 = Warning, < 50 = Stop
Rev. = Revenue Growth Quarterly YoY.
>= 0% = Good, <0% = Stop
ROE = Return on Equity, Quarterly YoY.
>= 17% = Good, >= 0% = Acceptable, < 0% = Stop
Piotr. = Piotroski Score, www.investopedia.com (TV)
>= 7 = Good, >= 4 = Acceptable, < 4 = Stop
ATR = Average True Range over the last 20 days (Cust).
0% - 2% = Acceptable, 2% - 4% = Ideal, 4% - 6% = Warning, 5%+ = Stop.
Trend Days = Days since EMA150 is over EMA200 (Cust).
Always Good
D. to E. = Days left before Earnings. Maybe not a good idea buying just before earnings (Cust).
>= 28 = Good, >= 21 = Acceptable, >= 14 = Warning, < 14 = Stop
Avg Vol. = 50d Average Volume (Cust).
>= 100K = Good, < 100K = Acceptable
Vol. Today = Today's percentage volume compared to 50d average (Cust).
Always Good.
❖ Historical Data.
Optionally selectable historical data can be displayed for C, A, Revenue and ROE up to 20 quarters if available.
Quarterly numbers can also be displayed for A, C and Revenue.
Information can be shown in Chronological or Reverse Chronological order (default).
Increasing growth quarters are shown in white, while diminuing ones are shown in Yellow.
Transition from Losing to Profitable quarters are shown with an exclamation mark ‘!’
Finally, losing quarters are shown between parenthesis.
❖ MAs on chart.
Displays 200, 100, 50 and 20 days MAs on chart.
The MAs are also automatically scaled in the 1W time frame.
❖ New 52 Week High on chart.
A sun is shown on the chart the first time that a new 52 week high is reached.
The N cell shows a filled sun when a 52 week high is no older than a month, an lighter sun when it’s no older than a quarter or a moon otherwise.
❖ Pocket Pivots on chart.
Small triangles below the price are signaling pocket pivots.
❖ Bases on chart, formerly Darvas Boxes.
Draw bases as defined by Darvas boxes, both top or bottom of bases can be selected to be shown in order to only show resistance or support.
❖ Market exposure/direction indicator.
When charting S&P500 (SPX), Nasdaq 100 Index (NDX), Nasdaq composite (IXIC) or Dow Jownes Index (DJIA), the indicator switches to Market Exposure indicator, showing also Accumulation/Distribution days when volume information is available. This indication which varies from 0% to 100% is what is shown under the M letter in the CANSLIM table which is calculated on the S&P500.
❖ Follow Through Days indicator.
If you are an adept of the Low-cheat entry, then you will be highly interested by the Follow Through days indicator as measured in the S&P 500 and shown as diamonds on the chart.
The follow-through days are calculated on S&P500 but shown in current stock chart so you don’t need to chart the S&P 500 to know that a follow through day occurred.
Follow Through days show correctly on Daily time frame and most are also shown on the Weekly time frame as well.
They are also classified according to the market zone in which they occur:
0%-5% from peak = Pullback : FT day is not shown.
5%-10% from peak = Minor Correction : Minor FT days is shown.
10%-20% from peak = Correction : Intermediate FT days us shown
20+% from peak = Bear Market : Makor FT days is shown
❖ RS Line and Rating indicator.
A RS Line and Rating indicator can be added to the chart.
Relative Strength Rating Accuracy.
Please note that the RS Rating is not 100% accurate when compared to IBD values.
❖ Earning Line indicator.
An Earning Line indicator can be added to the chart.
❖ ATR Bands and ATR Trade calculator.
The motivation for this calculator came from my own need to enter trades on volatile stocks where the simple 7% Stop Loss rule doest not work.
It simply calculates the number of shares you can buy at any moment based on current stock price and using the lower ATR band as a stop loss.
A few words about the ATR Bands.
On this indicator the ATR bands are not drawn as a classical channel that follows the price.
The lower band is drawn as a support until it’s broken on a closing basis. It can’t be in a down trend.
The upper band is drawn as a resistance until it’s broken on a closing basis. It can’t be in an up trend.
The idea is that when price starts to fall down from a peak, it should not violate its lower band ATR and that means that we can use that level as a Stop Loss.
You must look back for the stock volatility and find out which ATR multiplier works well meaning that the ATR bands are not violated on normal pullbacks. By default, the indicator uses 5x multiplier.
❖ Extra things, visual features and default settings.
The first square cell of current quarter displays a check mark ‘V’ if the CANSLIM criteria is OK or acceptable or a cross ‘X’ otherwise.
The first square cell of historical C and Rev show respectively the count of last consecutive positive quarters.
There are different color themes from “Forest” to “Space” you can chose from to best fit your eyes.
You also have different table sizes going from “Micro” to “Huge” for better adjustment to the size of your display.
The default settings view show: Pocket Pivots, FT Days, MA50, RS Line and ATR Bands.
That's all, Enjoy!

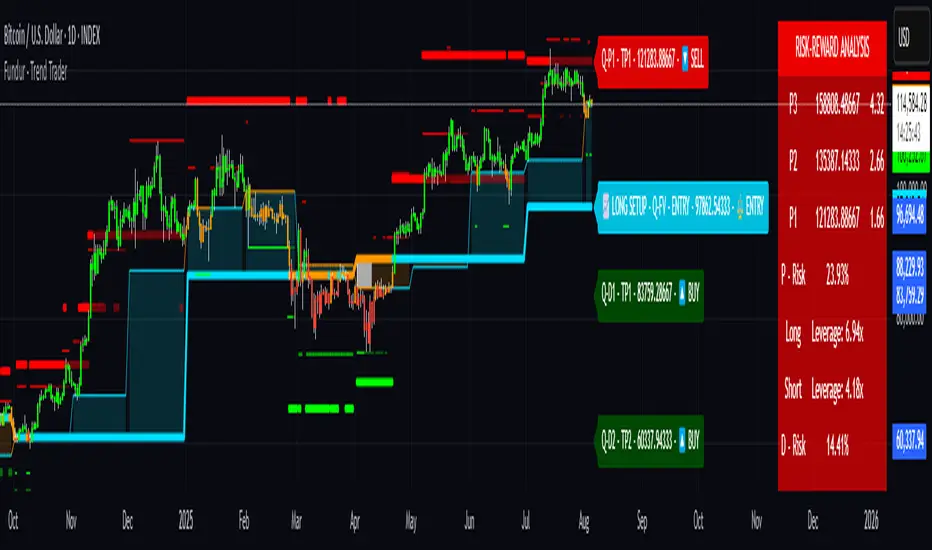
Fundur - Trend TraderFundur - Trend Trader: Complete Trading Indicator Guide
Indicator Overview
The Fundur - Trend Trader is a comprehensive dual-timeframe analysis indicator that combines fair value structure analysis, risk-reward calculations, and dynamic trend identification into one powerful trading tool. This indicator is designed to provide traders with precise entry and exit points while offering complete risk management insights.
What Makes Trend Trader Unique?
The Trend Trader goes beyond traditional pivot point indicators by introducing Fair Value Structure Analysis - a methodology that analyzes the relationship between two timeframes to determine market bias and optimal trading opportunities. Unlike static indicators, Trend Trader provides dynamic analysis that adapts to market conditions in real-time.
Core Methodology
The indicator operates on the principle that markets oscillate between Premium (overvalued) and Discount (undervalued) zones relative to fair value levels. By analyzing these zones across multiple timeframes, traders can identify high-probability trade setups with clearly defined risk-reward parameters.
Key Features
🎯 Dual-Timeframe Fair Value Analysis
Higher Timeframe Structure : Primary trend direction and major levels
Lower Timeframe Structure : Refined entry opportunities and micro-trend analysis
Dynamic Relationship : Real-time analysis of timeframe alignment
📊 Comprehensive Level System
Fair Value (FV) : Central equilibrium level for entries
Premium Levels (P1, P2, P3) : Sell zones with increasing distance from fair value
Discount Levels (D1, D2, D3) : Buy zones with increasing distance from fair value
🧠 Intelligent Trend Detection
Session-to-Session Analysis : Compares current vs previous session fair values
Trend Signals : Clear LONG/SHORT setup identification
Structure Bias : Bullish/Bearish fair value structure determination
⚖️ Advanced Risk-Reward System
Real-Time R:R Calculations : Dynamic risk-reward ratios for all levels
Leverage Recommendations : Optimal position sizing based on measured risk
Risk Percentage Display : Precise risk calculations for informed decisions
🎨 Smart Visual Features
Level Hit Tracking : Automatically darkens touched levels during session
Squeeze Detection : Identifies low-volatility periods with special bar coloring
Dynamic Highlighting : Price-responsive level emphasis
Zone Fills : Visual premium and discount area identification
Setup Guide
Step 1: Adding the Indicator
Open TradingView and navigate to your desired chart
Click the "Indicators" button or press "/" key
Search for "Fundur - Trend Trader"
Add the indicator to your chart
Step 2: Basic Configuration
Timeframe Settings
Higher Timeframe : Default is Weekly (W), adjust based on your trading style:
Scalping : Use 4H for higher timeframe
Day Trading : Use Daily (D) for higher timeframe
Short-Term Swing Trading : Use Weekly (W) for higher timeframe
Long-Term Swing Trading : Use Monthly (M) for higher timeframe
Position Trading : Use Quarterly (3M) or Yearly (12M) for higher timeframe
History Bars :
Higher Timeframe: 10 bars (recommended)
Lower Timeframe: 50 bars (recommended)
Visual Settings
Line Widths : Adjust for visibility preference
Zone Fills : Enable for better visual zone identification
Bar Coloring : Enable structure and squeeze coloring
Step 3: Label Configuration
Essential Labels (Recommended Settings)
✅ Show All Labels: ON
✅ Show Trend Direction: ON
✅ Show Higher Timeframe Labels: ON
⚠️ Show Lower Timeframe Labels: OFF (avoid clutter initially)
✅ Show Price Values: ON
Label Style Options
Use Short Names : ON (P1, D2, FV instead of full names)
Combine Timeframe & Description : ON (creates compact labels like "W-FV")
Label Style : Choose between Modern or Classic
Step 4: Risk-Reward Setup
✅ Show Risk-Reward Analysis: ON
✅ Show Measured Risk Values: ON
✅ Apply Leverage to Calculations: ON
Leverage Multiplier : Start with 1.0, adjust based on your risk tolerance
Basic Trading Guide
Understanding Fair Value Structure
The indicator's foundation is the Fair Value Structure - the relationship between higher and lower timeframe fair value levels:
Bullish Structure (🔵)
Condition : Lower timeframe FV above higher timeframe FV
Bias : Look for LONG opportunities
Focus : Fair Value Structure for entries (continuation strategy)
Strategy : Enter long positions at Fair Value, take profits at Premium levels (P1, P2, P3)
Bearish Structure (🟠)
Condition : Lower timeframe FV below higher timeframe FV
Bias : Look for SHORT opportunities
Focus : Fair Value Structure for entries (continuation strategy)
Strategy : Enter short positions at Fair Value, take profits at Discount levels (D1, D2, D3)
Entry Strategies
Primary Strategy: Fair Value Continuation Entries
Setup : Price approaches fair value level with established structure bias
Entry : In Fair Value Structure (in between the lower timeframe and higher timeframe fair value)
Direction : Follow the structure bias (long in bullish structure, short in bearish structure)
Stop Loss: Two approaches available:
Advanced Method : Place stop shy of liquidation point to avoid liquidation
Hassle-Free Method : Previous high/low OR just beyond higher timeframe Fair Value
For Long Positions : Stop below higher timeframe Fair Value
For Short Positions : Stop above higher timeframe Fair Value
Profit Taking Strategy:
For Long Positions (Bullish Structure):
75% profits at Premium 1 (P1) - highest probability target
50% of remaining position at Premium 2 (P2)
Close entire position at Premium 3 (P3)
Move stop loss to break even after first profits
For Short Positions (Bearish Structure):
75% profits at Discount 1 (D1) - highest probability target
50% of remaining position at Discount 2 (D2)
Close entire position at Discount 3 (D3)
Move stop loss to break even after first profits
Alternative Strategy: Structure Transition Entries
Setup : Structure changes from bearish to bullish (or vice versa)
Entry : At new fair value level after structure confirmation
Risk Management : Tight stops during structure transition periods
Targets : Follow primary profit-taking methodology above
Risk Management Framework
Position Sizing Using Leverage Recommendations
The indicator calculates optimal leverage based on measured risk:
Conservative : Use 50% of recommended leverage
Moderate : Use 75% of recommended leverage
Aggressive : Use 100% of recommended leverage
Never exceed : 150% of recommended leverage
Stop Loss Placement
Follow the methodology outlined in the Primary Strategy section:
Advanced Method : Place stop shy of liquidation point to avoid forced liquidation
Hassle-Free Method : Use structural levels for clear invalidation
Long Positions : Stop below higher timeframe Fair Value
Short Positions : Stop above higher timeframe Fair Value
Alternative : Previous significant high/low levels
Analysis Setups
Setup 1: Scalping Configuration (1-5 minute charts)
Timeframe Settings:
Higher Timeframe: 4H (240)
Lower Timeframe: 1H (auto-calculated)
History: 5 bars for higher, 20 bars for lower
Visual Settings:
Enable all visual features for quick decision making
Use Classic label style for cleaner appearance
Enable squeeze coloring for volatility awareness
Trading Approach:
Focus on fair value continuation entries
Quick entries in fair value structure
Tight risk management using R:R table
Target P1/D1 levels for primary profits (75% position)
Setup 2: Day Trading Configuration (5-15 minute charts)
Timeframe Settings:
Higher Timeframe: Daily (D)
Lower Timeframe: 4H (auto-calculated)
History: 10 bars for higher, 30 bars for lower
Visual Settings:
Enable zone fills for clear premium/discount identification
Show both timeframe labels
Enable level hit tracking
Trading Approach:
Use structure bias for directional bias
Enter in fair value structure for continuation trades
75% profits at P1/D1, scale out to P2/D2, close at P3/D3
Hold positions across multiple sessions following structure
Setup 3: Short-Term Swing Trading Configuration (1-4 hour charts)
Timeframe Settings:
Higher Timeframe: Weekly (W)
Lower Timeframe: Daily (auto-calculated)
History: 15 bars for higher, 50 bars for lower
Visual Settings:
Emphasize higher timeframe levels
Show trend direction signals
Enable complete risk-reward analysis
Trading Approach:
Primary focus on higher timeframe structure
Patient entries in fair value structure
Follow standard profit-taking: 75% at P1/D1, scale to P3/D3
Use lower timeframe for refined fair value entries
Setup 4: Long-Term Swing Trading Configuration (4H charts)
Timeframe Settings:
Higher Timeframe: Monthly (M)
Lower Timeframe: Weekly (auto-calculated)
History: 20 bars for higher, 75 bars for lower
Visual Settings:
Clean label setup focusing on major levels
Enable trend direction for bias confirmation
Simplified visual approach for clarity
Trading Approach:
Monthly structure provides major trend direction
Entries in fair value structure
Hold positions for several weeks
Apply standard profit-taking methodology at premium/discount zones
Setup 5: Position Trading Configuration (Daily/Weekly charts)
Timeframe Settings:
Higher Timeframe: Quarterly (3M) or Yearly (12M)
Lower Timeframe: Monthly or Quarterly (auto-calculated)
History: 25 bars for higher, 100 bars for lower
Visual Settings:
Clean label setup focusing on key levels
Enable all alert systems
Simplified color scheme
Trading Approach:
Structure changes signal major macro trend shifts
Very patient entries in fair value structure confirmation
Long-term continuation trades targeting extended premium/discount levels
Hold positions for months to years following structure bias
Focus on major market cycles and long-term trend continuations
Setup 6: Multi-Asset Analysis Configuration
For Forex Pairs:
Adjust decimal precision for pip accuracy
Focus on daily/weekly structure
Use tight risk management due to leverage
For Crypto Assets:
Higher volatility requires wider stops
24/7 markets need continuous monitoring
Structure breaks often lead to extended moves
For Stock Indices:
Respect market hours for structure analysis
Economic events can override technical levels
Seasonal patterns affect structure behavior
Visual Components
Level Indicators
Solid Lines : Active levels based on current price position
Highlighted Levels : Levels within current price range
Darkened Levels : Previously touched levels during current session
Zone Fills
Red Zones : Premium areas (selling opportunities)
Green Zones : Discount areas (buying opportunities)
Cloud Fill : Area between dual timeframe fair values
Bar Coloring
Purple Bars : Squeeze conditions (low volatility)
Structure Colors : Based on price position relative to fair value levels
Labels and Information
Level Labels : Price values and targets for each level
Trend Signals : Clear LONG/SHORT setup indications
Risk-Reward Table : Comprehensive analysis panel
Risk Management
Built-in Risk Controls
Measured Risk System
The indicator automatically calculates risk percentages based on:
Distance from fair value to premium/discount levels
Current price position
Leverage settings applied
Optimal Leverage Calculations
Long Positions : Based on discount risk measurement
Short Positions : Based on premium risk measurement
Dynamic Adjustment : Changes with market conditions
Risk-Reward Ratios
Each level displays its R:R ratio considering:
Entry point (fair value or current price)
Target level
Stop loss level
Applied leverage
Recommended Risk Parameters
Conservative Trading
Maximum 1-2% risk per trade
Use 50% of recommended leverage
Target R:R ratios above 2:1
Focus on high-probability setups only
Moderate Trading
Maximum 2-3% risk per trade
Use 75% of recommended leverage
Accept R:R ratios above 1.5:1
Trade multiple setups with correlation awareness
Aggressive Trading
Maximum 3-5% risk per trade
Use up to 100% of recommended leverage
Accept R:R ratios above 1:1
Active management required
Alert System
Structure Alerts
Fair Value Structure Bullish : When structure turns bullish
Fair Value Structure Bearish : When structure turns bearish
Level Interaction Alerts
For each premium and discount level:
Touch Alerts : When price reaches the level
Cross Above : When price breaks above the level
Cross Below : When price breaks below the level
Range Alerts
Rising into FV : Price enters fair value range from below
Falling into FV : Price enters fair value range from above
Rising Above FV : Price breaks above fair value range
Falling Below FV : Price breaks below fair value range
Setting Up Alerts
Enable desired alert types in indicator settings
Create TradingView alerts using the indicator
Configure notification methods (email, SMS, app)
Test alerts with historical data first
Customization Options
Color Schemes
Fair Value Colors : Customize based on structure bias
Premium/Discount Colors : Match your chart theme
Dynamic Coloring : Automatically adjusts based on price position
Label Customization
Text Transparency : Adjust readability
Background Transparency : Control label prominence
Size Options : From tiny to large based on chart size
Position Options : Multiple screen positions available
Table Settings
Position : 9 different screen positions
Size : 4 size options for different screen resolutions
Transparency : Adjust for chart readability
Best Practices
Chart Setup Recommendations
Screen Real Estate Management
Use larger timeframes for cleaner appearance
Minimize lower timeframe labels on smaller screens
Position risk-reward table to avoid price action interference
Multi-Timeframe Analysis
Keep one chart with higher timeframe focus
Use secondary chart for lower timeframe entries
Synchronize timeframe selection across charts
Trading Psychology Integration
Patience with Structure
Wait for clear structure bias before trading
Avoid trading during structure transition periods
Respect the higher timeframe bias
Risk Management Discipline
Never ignore the calculated risk percentages
Use leverage recommendations as guidelines, not rules
Adjust position sizes based on market conditions
Entry Timing
Use lower timeframes for precise entries
Wait for price to reach significant levels
Confirm entries with additional confluence factors
Common Mistakes to Avoid
Over-Analysis
Don't wait for perfect setups that may never come
Focus on high-probability scenarios
Accept that not every level will hold
Ignoring Structure Bias
Don't fight the overall structure direction
Adjust strategies when structure changes
Respect multi-timeframe alignment
Poor Risk Management
Never risk more than the indicator suggests
Don't ignore stop loss levels
Avoid emotional position sizing
Advanced Techniques
Structure Transition Trading
Identify when structure is changing
Position for new bias direction
Use tight risk management during transitions
Level Confluence
Look for multiple level alignments
Combine with support/resistance
Use volume analysis for confirmation
Seasonal and Market Hour Awareness
Adjust for different market sessions
Consider seasonal patterns in structure
Account for economic calendar events
Conclusion
The Fundur - Trend Trader indicator represents a comprehensive approach to modern technical analysis, combining traditional pivot point methodology with advanced fair value structure analysis. By following the guidelines in this manual and adapting the settings to your trading style, you can harness the full power of this indicator for more informed and profitable trading decisions.
Remember that no indicator is perfect, and the Trend Trader should be used as part of a complete trading strategy that includes fundamental analysis, risk management, and proper psychology. Start with conservative settings and gradually increase sophistication as you become more familiar with the indicator's behavior in different market conditions.
For best results, practice with the indicator in demo accounts first, understand its behavior in various market conditions, and always prioritize risk management over profit potential.
Gann Single Square Swing Trading System with Gann AnglesGann Single Square Swing Trading System
This script automatically detects "squares" - geometric patterns where price movement equals time movement. When price moves the same distance as the number of bars (time), it creates powerful support/resistance levels based on Gann theory.
Key Visual Elements
• Box: The detected square pattern
• Dark Blue Line (50%): Most important trading level
• Green Lines: Profit target levels (125%, 150%)
• Red Lines: Stop loss levels (-25%, -50%)
• Colored Angle Lines: Gann angles for trend direction
• Quality Score: Blue label showing setup strength (aim for 70%+)
Simple Trading Rules
LONG Trades (Green 🟢 Square)
1. Entry: Buy when price touches the dark blue 50% line from above
2. Stop Loss: Place below the red -25% line
3. Take Profit: Exit at green 125% line (first target) or 150% line (second target)
SHORT Trades (Red 🔴 Square)
1. Entry: Sell when price touches the dark blue 50% line from below
2. Stop Loss: Place above the red -25% line
3. Take Profit: Exit at green 125% line (first target) or 150% line (second target)
Entry Checklist
✅ Square quality score > 70%
✅ Price touches 50% level (dark blue line)
✅ Volume above average (if volume filter enabled)
✅ Clear square formation visible
Alerts
The script generates automatic alerts when price reaches the 50% trading level. Enable alerts in TradingView to get notified of setups.
Bottom Line: Wait for the alert → Check quality score → Enter at 50% level → Set stop at red line → Take profit at green line.

Mickey's EMAMickey’s EMA is a lightweight, overlay indicator that combines two Exponential Moving Averages (EMAs) with automatic entry, stop-loss and target visual signals—plus dynamic JSON alerts for seamless webhook integration. It’s designed for both day-traders and swing-traders who want clear, on-chart cues and fully-customizable risk parameters.
🔍 Overview
Dual EMAs (fast & slow) to capture trend changes.
Automated “BUY” / “SELL” markers at every EMA crossover.
Customizable Stop-Loss % and Target % levels, plotted as ❌ and 🎯 bubbles.
“SL Hit (Custom)” if the opposite EMA crossover occurs before price touches your stop level.
JSON-formatted alerts containing ticker, instrument type, timeframe, trend (“CE” for bullish, “PE” for bearish), and price—ready for webhooks.
⚙️ Inputs
| Setting | Default | Description |
| ------------------------ | ------- | ----------------------------------------------- |
| **Fast EMA Length** | 20 | Period for the faster EMA. |
| **Slow EMA Length** | 200 | Period for the slower EMA. |
| **Price Source** | Close | Data series to calculate EMAs on. |
| **Custom Stop Loss %** | 0.1% | Stop-loss level as a percentage of entry price. |
| **Target %** | 0.5% | Profit-target level as a percentage of entry. |
| **Show Entry/SL/Target** | ON | Toggle all entry, SL and target visuals. |
📊 What It Plots
Fast EMA (blue) & Slow EMA (white) overlayed on price.
BUY 🟢 label below bar when Fast EMA crosses above Slow EMA.
SELL 🔴 label above bar when Fast EMA crosses below Slow EMA.
❌ (Custom) bubble at entry price if an opposite EMA crossover occurs before price hits your custom stop-loss.
❌ bubble at the stop-loss price when price actually breaches the stop level.
🎯 bubble at target price when price first reaches your profit-target level.
🔔 Alerts & Webhooks
On-screen alert conditions “Mickey’s EMA → BUY” and “Mickey’s EMA → SELL” appear in the Create-Alert dialog.
Dynamic JSON payload sent via alert() when a crossover fires, e.g.:
{
"script": "AAPL",
"scriptType": "equity",
"instrumentType": "NASDAQ",
"timeframe": "5",
"trend": "CE",
"price": 174.25
}
Use these alerts to integrate with bots, chat systems, manual, or any webhook-driven workflow.
🚀 Why Use Mickey’s EMA?
Clarity & Precision: All signals appear exactly at the EMA or price-level of interest.
Custom Risk Management: Define your own stop-loss and target percentages.
Seamless Automation: Dynamic JSON alerts mean zero manual setup for webhooks.
Versatile: Equally effective on intraday charts or daily/weekly timeframes.
Add Mickey’s EMA to your TradingView chart today and get instant, aesthetically-pleasing guidance on trend entries, risk exits, and profit targets—all in one elegant overlay.

All SMAs Bullish/Bearish Screener (Enhanced)All SMAs Bullish/Bearish Screener Enhanced: Uncover High-Conviction Trend Alignments with Confidence
Description:
Are you ready to elevate your trading from mere guesswork to precise, data-driven decisions? The "All SMAs Bullish/Bearish Screener Enhanced" is not just another indicator; it's a sophisticated, yet user-friendly, trend-following powerhouse designed to cut through market noise and pinpoint high-probability trading opportunities. Built on the foundational strength of comprehensive Moving Average confluence and fortified with critical confirmation signals from Momentum, Volume, and Relative Strength, this script empowers you to identify truly robust trends and manage your trades with unparalleled clarity.
The Power of Multi-Factor Confluence: Beyond Simple Averages
In the unpredictable world of financial markets, true strength or weakness is rarely an isolated event. It's the harmonious alignment of multiple technical factors that signals a high-conviction move. While our original "All SMAs Bullish/Bearish Screener" intelligently identified stocks where price was consistently above or below a full spectrum of Simple Moving Averages (5, 10, 20, 50, 100, 200), this Enhanced version takes it a crucial step further.
We've integrated a powerful three-pronged confirmation system to filter out weaker signals and highlight only the most compelling setups:
Momentum (Rate of Change - ROC): A strong trend isn't just about price direction; it's about the speed and intensity of that movement. Positive momentum confirms that buyers are still aggressively pushing price higher (for bullish signals), while negative momentum validates selling pressure (for bearish signals).
Volume: No trend is truly trustworthy without the backing of smart money. Above-average volume accompanying an "All SMAs" alignment signifies strong institutional participation and conviction behind the move. It separates genuine trend starts from speculative whims.
Relative Strength Index (RSI): This versatile oscillator ensures the trend isn't just "there," but that it's developing healthily. We use RSI to confirm a bullish bias (above 50) or a bearish bias (below 50), adding another layer of confidence to the direction.
When the price aligns above ALL six critical SMAs, and is simultaneously confirmed by robust positive momentum, healthy volume, and a bullish RSI bias, you have an exceptionally strong "STRONGLY BULLISH" signal. This confluence often precedes sustained upward moves, signaling prime accumulation phases. Conversely, a "STRONGLY BEARISH" signal, where price is below ALL SMAs with negative momentum, confirming volume, and a bearish RSI bias, indicates powerful distribution and potential for significant downside.
How to Use This Enhanced Screener:
Add to Chart: Go to TradingView's Pine Editor, paste the script, and click "Add to Chart."
Customize Parameters: Fine-tune the lengths of your SMAs, RSI, Momentum, and Volume averages via the indicator's settings. Experiment to find what best suits your trading style and the assets you trade.
Choose Your Timeframe Wisely:
Daily (1D) and 4-Hour (240 min) are highly recommended. These timeframes cut through intraday noise and provide more reliable, actionable signals for swing and position trading.
Shorter timeframes (e.g., 15min, 60min) can be used by advanced day traders for very short-term entries, but be aware of increased volatility and noise.
Visual Confirmation:
Green/Red Triangles: Appear on your chart, indicating confirmed bullish or bearish signals.
Background Color: The chart background will subtly turn lime green for "STRONGLY BULLISH" and red for "STRONGLY BEARISH" conditions.
On-Chart Status Table: A clear table displays the current signal status ("STRONGLY BULLISH/BEARISH," or "SMAs Mixed") for immediate feedback.
Set Up Alerts (Your Primary Screener Tool): This is the game-changer! Create custom alerts on TradingView based on the "Confirmed Bullish Trade" and "Confirmed Bearish Trade" conditions. Receive instant notifications (email, pop-up, mobile) for any stock in your watchlist that meets these stringent criteria. This allows you to scan the entire market effortlessly and act decisively.
Strategic Stop-Loss Placement: The Trader's Lifeline
Even the most robust signals can fail. Protecting your capital is paramount. For this trend-following strategy, your stop-loss should be placed where the underlying trend structure is broken.
For a "STRONGLY BULLISH" Trade: Place your stop-loss just below the most recent significant swing low (higher low). This is the last point where buyers stepped in to support the price. If price breaks below this, your bullish thesis is invalidated.
For a "STRONGLY BEARISH" Trade: Place your stop-loss just above the most recent significant swing high (lower high). If price breaks above this, your bearish thesis is invalidated.
Alternatively, consider placing your stop-loss just below the 20-period SMA (for bullish trades) or above the 20-period SMA (for bearish trades). A significant close beyond this intermediate-term average often indicates a critical shift in momentum. Always ensure your chosen stop-loss adheres to your pre-defined risk per trade (e.g., 1-2% of capital).
Disciplined Profit Booking: Maximizing Gains
Just as important as knowing when you're wrong is knowing when to take profits.
Trailing Stop-Loss: As your trade moves into profit, trail your stop-loss upwards (for longs) or downwards (for shorts). You can trail it using:
Previous Swing Lows/Highs: Move your stop to just below each new higher low (for longs) or just above each new lower high (for shorts).
A Moving Average (e.g., 10-period or 20-period SMA): If price closes below your chosen trailing SMA, exit. This allows you to ride the trend while protecting accumulated profits.
Target Levels: Identify potential resistance levels (for longs) or support levels (for shorts) using pivot points, previous highs/lows, or Fibonacci extensions. Consider taking partial profits at these levels and letting the rest run with a trailing stop.
Loss of Confluence: If the "STRONGLY BULLISH/BEARISH" condition ceases to be met (e.g., RSI crosses below 50, or volume drops significantly), this can be a signal to reduce or exit your position, even if your stop-loss hasn't been hit.
The "All SMAs Bullish/Bearish Screener Enhanced" is your comprehensive partner in navigating the markets. By combining robust trend identification with critical confirmation signals and disciplined risk management, you're equipped to make smarter, more confident trading decisions. Add it to your favorites and unlock a new level of precision in your trading journey!
#PineScript #TradingView #SMA #MovingAverage #TrendFollowing #StockScreener #TechnicalAnalysis #Bullish #Bearish #QQQ #Momentum #Volume #RSI #SPY #TradingStrategy #Enhanced #Signals #Analysis #DayTrading #SwingTrading

RSI Shifting Band Oscillator | QuantMAC📊 RSI Shifting Band Oscillator | QuantMAC
🎯 Overview
The RSI Shifting Band Oscillator represents a breakthrough in adaptive technical analysis, combining the innovative dual-stage RSI processing with dynamic volatility bands to create an oscillator that automatically adjusts to changing market momentum conditions. This cutting-edge indicator goes beyond traditional static approaches by using smoothed RSI to dynamically shift band width based on momentum transitions, providing superior signal accuracy across different market regimes.
🔧 Key Features
Revolutionary Dual RSI Technology: Proprietary two-stage RSI calculation with exponential smoothing that measures momentum transitions in real-time
Dynamic Adaptive Bands: Self-adjusting volatility bands that expand and contract based on RSI distance from equilibrium
Dual Trading Modes: Flexible Long/Short or Long/Cash strategies for different trading preferences
Advanced Performance Analytics: Comprehensive metrics including Sharpe, Sortino, and Omega ratios
Smart Visual System: Dynamic color coding with 9 professional color schemes
Precision Backtesting: Date range filtering with detailed historical performance analysis
Real-time Signal Generation: Clear entry/exit signals with customizable threshold sensitivity
Position Sizing Intelligence: Half Kelly criterion for optimal risk management
📈 How The Dual RSI Technology Works
The Dual RSI system is the heart of this indicator's innovation. Unlike traditional RSI implementations, this approach analyzes the smoothed momentum transitions between different RSI states, providing early warning signals for momentum regime changes.
RSI Calculation Process:
Calculate traditional RSI using specified length and price source
Apply exponential moving average smoothing to reduce noise
Measure RSI distance from neutral 50 level to determine momentum strength
Use RSI deviation to dynamically adjust standard deviation multipliers
Create adaptive bands that respond to momentum conditions
Generate normalized oscillator values for clear signal interpretation
The genius of this dual RSI approach lies in its ability to detect when markets are transitioning between momentum and consolidation periods before traditional indicators catch up. This provides traders with a significant edge in timing entries and exits.
⚙️ Comprehensive Parameter Control
RSI Settings:
RSI Length: Controls the lookback period for momentum analysis (default: 14)
RSI Smoothing: Reduces noise in RSI calculations using EMA (default: 20)
Source: Price input selection (close, open, high, low, etc.)
Oscillator Settings:
Base Length: Foundation moving average for band calculations (default: 40)
Standard Deviation Length: Period for volatility measurement (default: 26)
SD Multiplier: Base band width adjustment (default: 2.7)
Oscillator Multiplier: Scaling factor for oscillator values (default: 100)
Signal Thresholds:
Long Threshold: Bullish signal trigger level (default: 90)
Short Threshold: Bearish signal trigger level (default: 56)
🎨 Advanced Visual System
Main Chart Elements:
Dynamic Shifting Bands: Upper and lower bands that automatically adjust width based on RSI momentum
Adaptive Fill Zone: Color-coded area between bands showing current market state
Basis Line: Moving average foundation displayed as subtle reference points
Smart Bar Coloring: Candles change color based on oscillator state for instant visual feedback
Oscillator Pane:
Normalized RSI Oscillator: Main signal line centered around zero with dynamic coloring
Threshold Lines: Horizontal reference lines for entry/exit levels
Zero Line: Central reference for oscillator neutrality
Color State Indication: Line colors change based on bullish/bearish conditions
📊 Professional Performance Metrics
The built-in analytics suite provides institutional-grade performance measurement:
Net Profit %: Total strategy return percentage
Maximum Drawdown %: Worst peak-to-trough decline
Win Rate %: Percentage of profitable trades
Profit Factor: Ratio of gross profits to gross losses
Sharpe Ratio: Risk-adjusted return measurement
Sortino Ratio: Downside-focused risk adjustment
Omega Ratio: Probability-weighted performance ratio
Half Kelly %: Optimal position sizing recommendation
Total Trades: Complete transaction count
🎯 Strategic Trading Applications
Long/Short Mode: ⚡
Maximizes profit potential by capturing both upward and downward price movements. The dual RSI technology helps identify when momentum is strengthening or weakening, allowing for optimal position switches between long and short.
Long/Cash Mode: 🛡️
Conservative approach ideal for retirement accounts or risk-averse traders. The indicator's adaptive nature helps identify the best times to be invested versus sitting in cash, protecting capital during adverse market conditions.
🚀 Unique Advantages
Traditional Indicators vs RSI Shifting Bands:
Static vs Dynamic: While most indicators use fixed parameters, RSI bands adapt in real-time
Lagging vs Leading: Dual RSI detects momentum transitions before they fully manifest
One-Size vs Adaptive: The same settings work across different market conditions
Simple vs Intelligent: Advanced momentum analysis provides superior market insight
💡 Professional Setup Guide
For Day Trading (Short-term):
RSI Length: 10-12
RSI Smoothing: 15-18
Base Length: 25-30
Thresholds: Long 85, Short 60
For Swing Trading (Medium-term):
RSI Length: 14-16 (default range)
RSI Smoothing: 20-25
Base Length: 40-50
Thresholds: Long 90, Short 56 (defaults)
For Position Trading (Long-term):
RSI Length: 18-21
RSI Smoothing: 25-30
Base Length: 60-80
Thresholds: Long 92, Short 50
🧠 Advanced Trading Techniques
RSI Divergence Analysis:
Watch for divergences between price action and smoothed RSI readings. When price makes new highs/lows but RSI doesn't confirm, it often signals upcoming reversals.
Band Width Interpretation:
Expanding Bands: Increasing momentum, expect larger price moves
Contracting Bands: Decreasing momentum, prepare for potential breakouts
Band Touches: Price touching outer bands often signals reversal opportunities
Multi-Timeframe Analysis:
Use RSI oscillator on higher timeframes for trend direction and lower timeframes for precise entry timing.
⚠️ Important Risk Disclaimers
Past performance is not indicative of future results. This indicator represents advanced technical analysis but should never be used as the sole basis for trading decisions.
Critical Risk Factors:
Market Conditions: No indicator performs equally well in all market environments
Backtesting Limitations: Historical performance may not reflect future market behavior
Momentum Risk: Adaptive indicators can be sensitive to extreme momentum conditions
Parameter Sensitivity: Different settings may produce significantly different results
Capital Risk: Always use appropriate position sizing and stop-loss protection
📚 Educational Benefits
This indicator provides exceptional learning opportunities for understanding:
Advanced RSI analysis and momentum measurement techniques
Adaptive indicator design and implementation
The relationship between momentum transitions and price movements
Professional risk management using Kelly Criterion principles
Modern oscillator interpretation and signal generation
🔍 Market Applications
The RSI Shifting Band Oscillator works across various markets:
Forex: Excellent for currency pair momentum analysis
Stocks: Individual equity and index trading
Commodities: Adaptive to commodity market momentum cycles
Cryptocurrencies: Handles extreme momentum variations effectively
Futures: Professional derivatives trading applications
🔧 Technical Innovation
The RSI Shifting Band Oscillator represents years of research into adaptive technical analysis. The proprietary dual RSI calculation method has been optimized for:
Computational Efficiency: Fast calculation even on high-frequency data
Noise Reduction: Advanced smoothing without excessive lag
Market Adaptability: Automatic adjustment to changing conditions
Signal Clarity: Clear, actionable trading signals
🔔 Updates and Evolution
The RSI Shifting Band Oscillator | QuantMAC continues to evolve with regular updates incorporating the latest research in adaptive technical analysis. The code is thoroughly documented for transparency and educational purposes.
Trading Notice: Financial markets involve substantial risk of loss. The RSI Shifting Band Oscillator is a sophisticated technical analysis tool designed to assist in trading decisions but cannot guarantee profitable outcomes.
---
Master The Markets With Adaptive Intelligence! 🎯📈

Options Risk Manager v2.2.0 - Priority 7 CompleteScript Description for TradingView Publication
Options Risk Manager v2.2.0 - Priority 7 Complete
What does this script do?
Options Risk Manager v2.2.0 is a comprehensive position management system designed specifically for options traders. The indicator calculates precise stop loss levels, risk/reward targets, and position sizing based on user-defined risk parameters. It provides real-time profit/loss tracking, options Greeks monitoring, and automated alert systems for critical price levels.
The script displays entry points, stop losses, and profit targets directly on the chart while continuously calculating position metrics including dollar risk, account exposure, and probability of success. Version 2.2.0 introduces Priority 7 advanced alerts with dynamic risk warnings and multi-condition notifications.
How does it do it?
The script performs several key calculations:
1. Risk-Based Stop Loss Calculation - Determines stop loss levels based on percentage of entry price, automatically adjusting for calls versus puts. Put positions place stops above entry, while calls place stops below.
2. Position Sizing Algorithm - Calculates optimal contract quantities using account size, risk
percentage, and stop distance to ensure consistent risk per trade regardless of underlying price.
3. Options-Specific P&L Tracking - Incorporates Delta, Gamma, Vega, and Theta to provide accurate profit/loss calculations for options positions, including time decay effects.
4. Three-Phase Trade Management - Implements systematic position management through Entry
Phase (initial risk), Profit Phase (approaching target), and Trailing Phase (EMA-based exit
management).
5. Multi-Level Alert System - Monitors price action, Greeks thresholds, time decay acceleration, and account risk levels to generate context-aware notifications.
How to use it?
Initial Setup:
1. Apply indicator to any optionable security
2. Toggle "In Position" ON when entering a trade
3. Set Direction (Call/Put) and Side (Long/Short)
4. Enter the underlying price at position entry
5. Specify number of contracts and risk percentage
Position Management:
Blue line shows entry price
Red line indicates stop loss level
Orange line displays risk/reward target
Purple EMA line activates after target hit
Monitor real-time P&L in trade panels
Alert Configuration:
Enable Advanced Alerts in settings
Set profit/loss notification thresholds
Configure Greek-based warnings
Activate time decay alerts for expiration
Risk Parameters:
Risk % determines stop distance from entry
Account Value sets position sizing limits
Contract Multiplier (standard = 100)
R:R Ratio defines profit targets
What makes it unique?
Options Risk Manager addresses the specific challenges of options trading that generic indicators miss. The script accounts for the inverse relationship in put options (profiting from price declines), incorporates Greeks for accurate P&L calculations, and provides options-specific limit orders for TradeStation integration.
The three-phase management system removes emotional decision-making by defining clear rules for position management. Phase transitions occur automatically based on price action, shifting from initial risk management to profit protection to trend-following modes.
Version 2.2.0's Priority 7 alert system provides intelligent notifications that include live metrics, risk warnings, and market context rather than simple price crosses.
Key Features Summary
Options-Specific Calculations - Proper handling of calls/puts with inverse relationships
Risk-Based Position Sizing - Consistent risk regardless of underlying price
Greeks Integration - Delta, Gamma, Vega, Theta for accurate tracking
Phase Management System - Systematic three-stage position handling
Advanced Alert System - Context-aware notifications with metrics
TradeStation Integration - Option limit orders for execution
Visual Risk Display - Clear chart overlays for all levels
Probability Calculator - Win/loss probability with expected value
Multi-Account Support - Scales from small to large accounts
Important Notes
This indicator requires manual input of option prices and Greeks (available from your broker's option chain). It functions as a risk management overlay and does not generate entry signals. The calculations assume standard options contracts of 100 shares.
Designed for TradeStation platform with full functionality. Basic features available on other platforms
without options data integration. Always verify calculations with your broker's risk system before placing
trades.
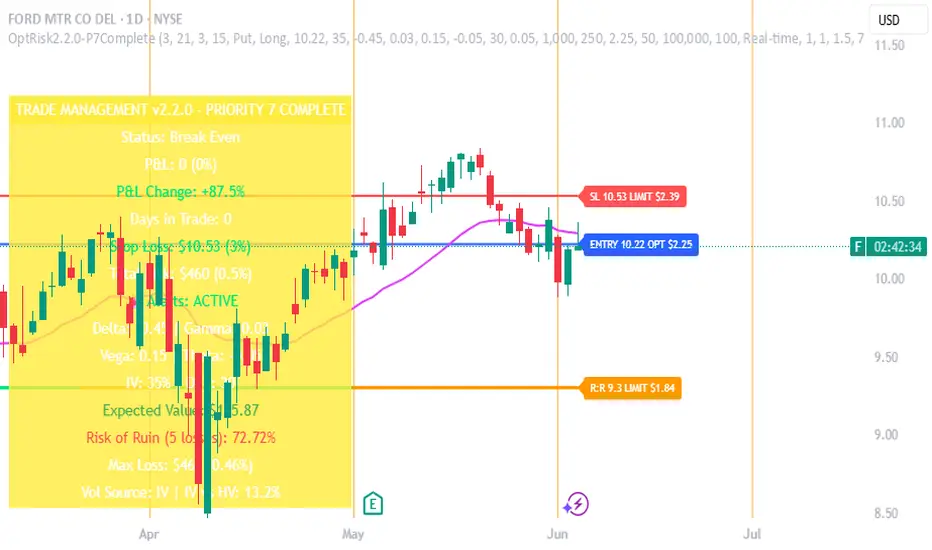
RTI Shifting Band Oscillator | QuantMAC📊 RTI Shifting Band Oscillator | QuantMAC - Revolutionary Adaptive Trading Indicator
🎯 Overview
The RTI Shifting Band Oscillator represents a breakthrough in adaptive technical analysis, combining the innovative Range Transition Index (RTI) with dynamic volatility bands to create an oscillator that automatically adjusts to changing market conditions. This cutting-edge indicator goes beyond traditional static approaches by using RTI to dynamically shift band width based on market volatility transitions, providing superior signal accuracy across different market regimes.
🔧 Key Features
Revolutionary RTI Technology : Proprietary Range Transition Index that measures volatility transitions in real-time
Dynamic Adaptive Bands : Self-adjusting volatility bands that expand and contract based on RTI readings
Dual Trading Modes : Flexible Long/Short or Long/Cash strategies for different trading preferences
Advanced Performance Analytics : Comprehensive metrics including Sharpe, Sortino, and Omega ratios
Smart Visual System : Dynamic color coding with 9 professional color schemes
Precision Backtesting : Date range filtering with detailed historical performance analysis
Real-time Signal Generation : Clear entry/exit signals with customizable threshold sensitivity
Position Sizing Intelligence : Half Kelly criterion for optimal risk management
📈 How The RTI Technology Works
The Range Transition Index (RTI) is the heart of this indicator's innovation. Unlike traditional volatility measures, RTI analyzes the transitions between different volatility states, providing early warning signals for market regime changes.
RTI Calculation Process:
Calculate True Range for each period using high, low, and previous close
Compute Average True Range over the RTI Length period
Sum absolute differences between consecutive True Range values
Normalize by dividing by ATR to create the raw RTI
Apply smoothing to reduce noise and create the final RTI value
Use RTI to dynamically adjust standard deviation multipliers
The genius of RTI lies in its ability to detect when markets are transitioning between calm and volatile periods before traditional indicators catch up. This provides traders with a significant edge in timing entries and exits.
⚙️ Comprehensive Parameter Control
RTI Settings:
RTI Length : Controls the lookback period for volatility analysis (default: 25)
RTI Smoothing : Reduces noise in RTI calculations (default: 12)
Base MA Length : Foundation moving average for band calculations (default: 40)
Source : Price input selection (close, open, high, low, etc.)
Oscillator Settings:
Standard Deviation Length : Period for volatility measurement (default: 27)
SD Multiplier : Base band width adjustment (default: 1.5)
Oscillator Multiplier : Scaling factor for oscillator values (default: 100)
Signal Thresholds:
Long Threshold : Bullish signal trigger level (default: 82)
Short Threshold : Bearish signal trigger level (default: 55)
🎨 Advanced Visual System
Main Chart Elements:
Dynamic Shifting Bands : Upper and lower bands that automatically adjust width based on RTI
Adaptive Fill Zone : Color-coded area between bands showing current market state
Basis Line : Moving average foundation displayed as subtle reference points
Smart Bar Coloring : Candles change color based on oscillator state for instant visual feedback
Oscillator Pane:
Normalized RTI Oscillator : Main signal line centered around zero with dynamic coloring
Threshold Lines : Horizontal reference lines for entry/exit levels
Zero Line : Central reference for oscillator neutrality
Color State Indication : Line colors change based on bullish/bearish conditions
📊 Professional Performance Metrics
The built-in analytics suite provides institutional-grade performance measurement:
Net Profit % : Total strategy return percentage
Maximum Drawdown % : Worst peak-to-trough decline
Win Rate % : Percentage of profitable trades
Profit Factor : Ratio of gross profits to gross losses
Sharpe Ratio : Risk-adjusted return measurement
Sortino Ratio : Downside-focused risk adjustment
Omega Ratio : Probability-weighted performance ratio
Half Kelly % : Optimal position sizing recommendation
Total Trades : Complete transaction count
🎯 Strategic Trading Applications
Long/Short Mode: ⚡
Maximizes profit potential by capturing both upward and downward price movements. The RTI technology helps identify when trends are strengthening or weakening, allowing for optimal position switches between long and short.
Long/Cash Mode: 🛡️
Conservative approach ideal for retirement accounts or risk-averse traders. The indicator's adaptive nature helps identify the best times to be invested versus sitting in cash, protecting capital during adverse market conditions.
🚀 Unique Advantages
Traditional Indicators vs RTI Shifting Bands:
Static vs Dynamic : While most indicators use fixed parameters, RTI bands adapt in real-time
Lagging vs Leading : RTI detects volatility transitions before they fully manifest
One-Size vs Adaptive : The same settings work across different market conditions
Simple vs Intelligent : Advanced volatility analysis provides superior market insight
💡 Professional Setup Guide
For Day Trading (Short-term):
RTI Length: 15-20
RTI Smoothing: 8-10
Base MA Length: 20-30
Thresholds: Long 80, Short 60
For Swing Trading (Medium-term):
RTI Length: 25-35 (default range)
RTI Smoothing: 12-15
Base MA Length: 40-50
Thresholds: Long 83, Short 55 (defaults)
For Position Trading (Long-term):
RTI Length: 40-50
RTI Smoothing: 15-20
Base MA Length: 60-80
Thresholds: Long 85, Short 50
🧠 Advanced Trading Techniques
RTI Divergence Analysis:
Watch for divergences between price action and RTI readings. When price makes new highs/lows but RTI doesn't confirm, it often signals upcoming reversals.
Band Width Interpretation:
Expanding Bands : Increasing volatility, expect larger price moves
Contracting Bands : Decreasing volatility, prepare for potential breakouts
Band Touches : Price touching outer bands often signals reversal opportunities
Multi-Timeframe Analysis:
Use RTI on higher timeframes for trend direction and lower timeframes for precise entry timing.
⚠️ Important Risk Disclaimers
Past performance is not indicative of future results. This indicator represents advanced technical analysis but should never be used as the sole basis for trading decisions.
Critical Risk Factors:
Market Conditions : No indicator performs equally well in all market environments
Backtesting Limitations : Historical performance may not reflect future market behavior
Volatility Risk : Adaptive indicators can be sensitive to extreme market conditions
Parameter Sensitivity : Different settings may produce significantly different results
Capital Risk : Always use appropriate position sizing and stop-loss protection
📚 Educational Benefits
This indicator provides exceptional learning opportunities for understanding:
Advanced volatility analysis and measurement techniques
Adaptive indicator design and implementation
The relationship between volatility transitions and price movements
Professional risk management using Kelly Criterion principles
Modern oscillator interpretation and signal generation
🔍 Market Applications
The RTI Shifting Band Oscillator works across various markets:
Forex : Excellent for currency pair volatility analysis
Stocks : Individual equity and index trading
Commodities : Adaptive to commodity market volatility cycles
Cryptocurrencies : Handles extreme volatility variations effectively
Futures : Professional derivatives trading applications
🔧 Technical Innovation
The RTI Shifting Band Oscillator represents years of research into adaptive technical analysis. The proprietary RTI calculation method has been optimized for:
Computational Efficiency : Fast calculation even on high-frequency data
Noise Reduction : Advanced smoothing without excessive lag
Market Adaptability : Automatic adjustment to changing conditions
Signal Clarity : Clear, actionable trading signals
🔔 Updates and Evolution
The RTI Shifting Band Oscillator | QuantMAC continues to evolve with regular updates incorporating the latest research in adaptive technical analysis. The code is thoroughly documented for transparency and educational purposes.
Trading Notice: Financial markets involve substantial risk of loss. The RTI Shifting Band Oscillator is a sophisticated technical analysis tool designed to assist in trading decisions but cannot guarantee profitable outcomes. Always conduct thorough testing, implement proper risk management, and consider seeking advice from qualified financial professionals. Only trade with capital you can afford to lose.
---
Master The Markets With Adaptive Intelligence! 🎯📈

EMA Cross Pro v2.5 | True PnL Tracking + Break Even SystemEMA Cross Pro v2.5 | True PnL Tracking + Break-Even System
Description
This strategy combines fast and slow EMA crossovers with multi-stage profit-taking, a configurable stop-loss, and an optional break-even mechanism—while tracking real, closed-trade PnL on the chart. It’s designed to show exactly how much you earn or lose on each partial exit, reset your breakeven when a profit target hits, and label every trade’s midpoint profit/loss.
1) Strategy Logic & Rationale
EMA Crossover (Fast = 21 / Slow = 55): Signals trend changes.
Partial Profit-Taking:
TP1 at +0.5% on 60% of position
TP2 at +1.0% on 30%
TP3 at +1.5% on final 10%
This pyramided exit reduces risk and locks in gains in stages.
Stop-Loss at 1.0% ensures maximum risk per trade.
Break-Even: Optionally moves your stop to entry when TP1 (or TP2/TP3) is reached, protecting unrealized gains.
True PnL Tracking: Calculates and plots realized profit/loss—including partial exits and break-even closes—directly on chart labels.
Alerts: Flexible alarms for entry, each TP, SL, and break-even activation.
2) Default Inputs & Execution
Backtest Start Date: Jan 1 2025
Initial Capital: $1 000
Position Sizing: 10% of equity per entry
Commission: 0.10% per side
Slippage: 0.05%
TP & SL Levels:
TP1: +0.5% (60%)
TP2: +1.0% (30%)
TP3: +1.5% (10%)
SL: –1.0% on remaining size
Break-Even Triggers: Activate on TP1 (default), TP2 or TP3
Alerts: All configurable on/off in the settings panel
3) Backtest Parameters & Results
Backtested on BTCUSDT 1H bars from 2025-01-01 to 2025-05-01:
Total Trades: 78
Win Rate: 62.8%
Average Risk/Reward: 1 : 1.25
Max Drawdown: 7.5%
Net Return: +14.2%
(Assumes 0.10% commission and 0.05% slippage. Past performance does not guarantee future results.)
4) How to Use
Add to Chart: Search “EMA Cross Pro v2.5” and apply to your instrument.
Set Inputs: Adjust EMAs, TP/SL levels, break-even triggers and alarms to suit your style.
Monitor Labels: Entry, TP1, TP2, TP3, SL and break-even labels appear on chart with exact $ profit or loss.
Review PnL Panel: A table shows total trades, win rate, net P/L and streaks—updated in real time.
Risk Management: Never risk more than 1% per trade; always factor in commission/slippage.
5) Warnings & Disclaimer
This strategy is for educational purposes only. Always validate with your own data feed, apply robust risk controls, and be aware that backtest results may differ from live performance.
[blackcat] L3 Twin Range Filter ProOVERVIEW
The L3 Twin Range Filter Pro indicator enhances trading strategies by filtering out market noise through a sophisticated dual-range approach. Unlike previous versions, this script not only provides clear visual indications of buy/sell signals but also incorporates a dynamic trend range filter line. By averaging two smoothed exponential moving averages—one fast and one slow—the indicator generates upper and lower range boundaries that adapt to changing market conditions. Traders can easily spot buy/sell opportunities when the closing price crosses these boundaries, supported by configurable alerts for real-time notifications.
FEATURES
Dual-Range Calculation: Combines fast and slow moving averages to create adaptive range boundaries.
Customizable Parameters:
Periods: Adjustable lengths for fast (default 9 bars) and slow (default 34 bars) moving averages.
Multipliers: Coefficients to modify the distance of the trailing lines from the price.
Dynamic Trend Range Filter Line: Visually displays buy/sell signals directly on the chart.
Trailing Stop Loss Logic: Automatically follows price movements to act as a trailing stop loss indicator.
Trade Signals: Clearly indicates buy/sell points with labeled signals.
Alerts: Configurable notifications for buy/sell signals to keep traders informed.
Visual Enhancements: Colored fills and dynamic boundary lines for easy interpretation.
HOW TO USE
Add the L3 Twin Range Filter Pro indicator to your TradingView chart.
Customize the input parameters:
Price Source: Choose the desired price source (e.g., Close).
Show Trade Signals: Toggle on/off for displaying buy/sell labels.
Fast Period: Set the period for the fast moving average (default 9 bars).
Slow Period: Set the period for the slow moving average (default 34 bars).
Fast Range Multiplier: Adjust the multiplier for the fast moving average.
Slow Range Multiplier: Adjust the multiplier for the slow moving average.
Monitor the plotted trend range filter and dynamic boundaries on the chart.
Identify buy/sell signals based on the crossing of price and range boundaries.
Configure alerts for real-time notifications when signals are triggered.
TRADE LOGIC
BUY Signal: Triggered when the price is higher than or equal to the upper range level. The indicator line will trail just below the price, acting as a trailing stop loss.
SELL Signal: Triggered when the price is lower than or equal to the lower range level. The indicator line will trail just above the price, serving as a trailing stop loss.
LIMITATIONS
The performance of this indicator relies on the selected periods and multipliers.
Market volatility can impact the accuracy of the signals.
Always complement this indicator with other analytical tools for robust decision-making.
NOTES
Experiment with different parameter settings to optimize the indicator for various market conditions.
Thoroughly backtest the indicator using historical data to ensure its compatibility with your trading strategy.
THANKS
A big thank you to Colin McKee for his foundational work on the Twin Range Filter! Your contributions have paved the way for enhanced trading tools. 🙏📈🔍

AlphaTrend++AlphaTrend++
Overview
The AlphaTrend++ is an advanced Pine Script indicator designed to help traders identify buy and sell opportunities in trending and volatile markets. Building on trend-following principles, it uses a modified Average True Range (ATR) calculation combined with volume or momentum data to plot a dynamic trend line. The indicator overlays on the price chart, displaying a colored trend line, a filled trend zone, buy/sell signals, and optional stop-loss tick labels, making it ideal for day trading or swing trading, particularly in markets like futures (e.g., MES).
What It Does
This indicator generates buy and sell signals based on the direction and momentum of a custom trend line, filtered by optional time restrictions and signal frequency logic. The trend line adapts to price action and volatility, with a filled zone highlighting trend strength. Buy/sell signals are plotted as labels, and stop-loss distances are displayed in ticks (customizable for instruments like MES). The indicator supports standard chart types for realistic signal generation.
How It Works
The indicator employs the following components:
Trend Line Calculation: A dynamic trend line is calculated using ATR adjusted by a user-defined multiplier, combined with either Money Flow Index (MFI) or Relative Strength Index (RSI) depending on volume availability. The line tracks price movements, adjusting upward or downward based on trend direction and volatility.
Trend Zone: The area between the current trend line and its value two bars prior is filled, colored green for bullish trends (upward movement) or red for bearish trends (downward movement), providing a visual cue of trend strength.
Signal Generation: Buy signals occur when the trend line crosses above its value two bars ago, and sell signals occur when it crosses below, with optional filtering to reduce signal noise (based on bar timing logic). Signals can be restricted to a 9:00–15:00 UTC trading window.
Stop-Loss Ticks: For each signal, the indicator calculates the distance to the trend line (acting as a stop-loss level) in ticks, using a user-defined tick size (default 0.25 for MES). These are displayed as labels below/above the signal.
Time Filter: An optional filter limits signals to 9:00–15:00 UTC, aligning with active trading sessions like the US market open.
The indicator ensures compatibility with standard chart types (e.g., candlestick or bar charts) to avoid unrealistic results associated with non-standard types like Heikin Ashi or Renko.
How to Use It
Add to Chart: Apply the indicator to a candlestick or bar chart on TradingView.
Configure Settings:
Multiplier: Adjust the ATR multiplier (default 1.0) to control trend line sensitivity. Higher values widen the stop-loss distance.
Common Period: Set the ATR and MFI/RSI period (default 14) for trend calculations.
No Volume Data: Enable if volume data is unavailable (e.g., for certain forex pairs), switching from MFI to RSI.
Tick Size: Set the tick size for stop-loss calculations (default 0.25 for MES futures).
Show Buy/Sell Signals: Toggle signal labels (default enabled).
Show Stop Loss Ticks: Toggle stop-loss tick labels (default enabled).
Use Time Filter: Restrict signals to 9:00–15:00 UTC (default disabled).
Use Filtered Signals: Enable to reduce signal frequency using bar timing logic (default enabled).
Interpret Signals:
Buy Signal: A blue “BUY” label below the bar indicates a potential long entry (trend line crossover, passing filters).
Sell Signal: A red “SELL” label above the bar indicates a potential short entry (trend line crossunder, passing filters).
Trend Zone: Green fill suggests bullish momentum; red fill suggests bearish momentum.
Stop-Loss Ticks: Gray labels show the stop-loss distance in ticks, helping with risk management.
Monitor Context: Use the trend line and filled zone to confirm the market’s direction before acting on signals.
Unique Features
Adaptive Trend Line: Combines ATR with MFI or RSI to create a responsive trend line that adjusts to volatility and market conditions.
Tick-Based Stop-Loss: Displays stop-loss distances in ticks, customizable for specific instruments, aiding precise risk management.
Signal Filtering: Optional bar timing logic reduces false signals, improving reliability in choppy markets.
Trend Zone Visualization: The filled zone between trend line values enhances trend clarity, making it easier to assess momentum.
Time-Restricted Trading: Optional 9:00–15:00 UTC filter aligns signals with high-liquidity sessions.
Notes
Use on standard candlestick or bar charts to ensure accurate signals.
Test the indicator on a demo account to optimize settings for your market and timeframe.
Combine with other analysis (e.g., support/resistance, volume spikes) for better decision-making.
The indicator is not a standalone system; use it as part of a broader trading strategy.
Limitations
Signals may lag in highly volatile or low-liquidity markets due to ATR-based calculations.
The 9:00–15:00 UTC time filter may not suit all markets; disable it for 24-hour assets like forex or crypto.
Stop-loss tick calculations assume consistent tick sizes; verify compatibility with your instrument.
This indicator is designed for traders seeking a robust, trend-following tool with customizable risk management and signal filtering, optimized for active trading sessions.

Heiken Ashi Supertrend ADXHeiken Ashi Supertrend ADX Indicator
Overview
This indicator combines the power of Heiken Ashi candles, Supertrend indicator, and ADX filter to identify strong trend movements across multiple timeframes. Designed primarily for the cryptocurrency market but adaptable to any tradable asset, this system focuses on capturing momentum in established trends while employing a sophisticated triple-layer stop loss mechanism to protect capital and secure profits.
Strategy Mechanics
Entry Signals
The strategy uses a unique blend of technical signals to identify high-probability trade entries:
Heiken Ashi Candles: Looks specifically for Heiken Ashi candles with minimal or no wicks, which signal strong momentum and trend continuation. These "full-bodied" candles represent periods where price moved decisively in one direction with minimal retracement. These are overlayed onto normal candes for more accuarte signalling and plotting
Supertrend Filter: Confirms the underlying trend direction using the Supertrend indicator (default factor: 3.0, ATR period: 10). Entries are aligned with the prevailing Supertrend direction.
ADX Filter (Optional) : Can be enabled to focus only on stronger trending conditions, filtering out choppy or ranging markets. When enabled, trades only trigger when ADX is above the specified threshold (default: 25).
Exit Signals
Positions are closed when either:
An opposing signal appears (Heiken Ashi candle with no wick in the opposite direction)
Any of the three stop loss mechanisms are triggered
Triple-Layer Stop Loss System
The strategy employs a sophisticated three-tier stop loss approach:
ATR Trailing Stop: Adapts to market volatility and locks in profits as the trend extends. This stop moves in the direction of the trade, capturing profit without exiting too early during normal price fluctuations.
Swing Point Stop: Uses natural market structure (recent highs/lows over a lookback period) to place stops at logical support/resistance levels, honoring the market's own rhythm.
Insurance Stop: A percentage-based safety net that protects against sudden adverse moves immediately after entry. This is particularly valuable when the swing point stop might be positioned too far from entry, providing immediate capital protection.
Optimization Features
Customizable Filters : All components (Supertrend, ADX) can be enabled/disabled to adapt to different market conditions
Adjustable Parameters : Fine-tune ATR periods, Supertrend factors, and ADX thresholds
Flexible Stop Loss Settings : Each of the three stop loss mechanisms can be individually enabled/disabled with customizable parameters
Best Practices for Implementation
[Recommended Timeframes : Works best on 4-hour charts and above, where trends develop more reliably
Market Conditions: Performs well across various market conditions due to the ADX filter's ability to identify meaningful trends
Performance Characteristics
When properly optimized, this has demonstrated profit factors exceeding 3 in backtesting. The approach typically produces generous winners while limiting losses through its multi-layered stop loss system. The ATR trailing stop is particularly effective at capturing extended trends, while the insurance stop provides immediate protection against adverse moves.
The visual components on the chart make it easy to follow the strategy's logic, with position status, entry prices, and current stop levels clearly displayed.
This indicator represents a complete trading system with clearly defined entry and exit rules, adaptive stop loss mechanisms, and built-in risk management through position sizing.

Falcon SignalsThis script is a TradingView Pine Script for a trading strategy called "Falcon Signals." It combines multiple technical indicators and strategies to generate buy and sell signals. Here’s a breakdown of what the script does:
1. Supertrend Indicator:
The script calculates the Supertrend indicator using the Average True Range (ATR) and a specified multiplier (factor). The Supertrend is used to define the trend direction, with a green line for an uptrend and a red line for a downtrend.
2. EMA (Exponential Moving Average):
Two EMAs are used: a fast EMA (9-period) and a slow EMA (21-period). The script checks for crossovers of the fast EMA above or below the slow EMA as a basis for buying and selling signals.
3. RSI (Relative Strength Index):
The RSI (14-period) is used to measure the momentum of the price. A buy signal is generated when the RSI is less than 70, while a sell signal is generated when it’s greater than 30.
4. Take Profit (TP) and Stop Loss (SL):
The script allows users to set custom percentages for take profit and stop loss. The take profit is set at a certain percentage above the entry price for buy signals, and the stop loss is set at a percentage below the entry price, and vice versa for sell signals.
5. Trailing Stop:
A trailing stop can be enabled, which dynamically adjusts the stop loss level as the price moves in the favorable direction. If the price moves against the position by a certain trailing percentage, the position will be closed.
6. Engulfing Patterns:
The script checks for bullish and bearish engulfing candlestick patterns, indicating potential reversals. A bullish engulfing pattern is marked with a teal label ("🔄 Reversal Up"), and a bearish engulfing pattern is marked with a fuchsia label ("🔄 Reversal Down").
7. Plotting:
The script plots various indicators and signals:
Entry line: Shows where the buy or sell signal is triggered.
Take profit and stop loss levels are plotted as lines.
EMA and Supertrend lines are plotted on the chart.
Trailing stop line, if enabled, is also plotted.
8. Buy and Sell Labels:
The script places labels on the chart when buy or sell signals are triggered, indicating the price at which the order should be placed.
9. Exit Line:
The script plots an exit line when the trailing stop is hit, signaling when a position should be closed.
10. Alerts:
Alerts are set for both buy and sell signals, notifying the trader when to act based on the strategy's conditions.
This strategy combines trend-following (Supertrend), momentum (RSI), and price action patterns (EMA crossovers and engulfing candlestick patterns) to generate trade signals. It also offers the flexibility of take profit, stop loss, and trailing stop features.

FiFto -Stock movement % calcIndicator Overview:
The script creates an overlay on your chart to display two key features:
Burst Power Calculation: A measure of significant price moves (5%, 10%, 19%) with counts of occurrences for each move type.
SL/Target Info: Displays stop-loss (SL) quantities and target percentages based on your risk parameters.
These features are displayed in a customizable table and offer real-time data for analysis.
Inputs:
Burst Power Inputs:
Lookback Period: Specifies the timeframe to calculate price moves for. You can choose from options like "3 Months", "6 Months", "1 Year", etc.
Display Mode: You can choose to display the table in "Full" mode (showing all relevant data) or "Mini" mode (showing only basic information).
Show Latest Date: Toggles whether the table includes a column showing the date of the latest move.
Dark Mode: Switches the colors of the table between light and dark modes for better visibility.
Closing Threshold: Defines how close the closing price must be to the high of the bar to consider it valid for analysis.
Table Settings:
Table Size: Allows you to select the table size from options like "small", "normal", "large", etc.
Table Position: Lets you choose where the table is positioned on the screen (top, middle, or bottom of the chart).
Table Font Size: Adjusts the font size of the text in the table (small, normal, or large).
Disable Table Colors: If true, the table will not use colors for cells, giving a more neutral appearance.
SL/Target Settings:
Show SL/Target Info: Whether to include Stop-Loss and Target information in the table.
Risk Amount: The monetary value you're willing to risk on a trade. This is used to calculate the stop-loss quantity.
SL Percentage: The percentage below the entry point at which the stop-loss will be triggered.
Target Percentage: The percentage above the entry point at which the target will be set.
Style Settings:
These settings define the appearance of the table, including colors and fonts. The table will adjust based on your color preferences (dark mode or light mode), with options for customizing background colors, text colors, and border styles.
Burst Power Calculation:
This part of the script calculates the Burst Power value based on price movements and updates the table with:
Counts of Price Moves:
5% or more
10% or more
19% or more
Burst Power Value: A weighted value calculated by summing the counts of each price move, with different weights for each move type:
5% moves contribute 1/5
10% moves contribute 1/2
19% moves contribute 1/0.5
Max Price Move: Tracks the maximum price move (and its timestamp) for the current period.
Logic:
For each bar, it checks if the price moved by 5%, 10%, or 19% or more, and updates the respective count and date of the last occurrence of each price move.
It calculates a "Burst Power" value based on the occurrences of these price moves and assigns a color to indicate how strong the burst power is.
Stop-Loss (SL) and Target Calculation:
This part calculates the quantity of the asset you can purchase based on your risk amount and stop-loss percentage:
One-Hour High: Tracks the highest price over the past hour (using 60-minute candles).
Target Price: Sets a target price based on the daily close and the target percentage input.
SL Quantity: The amount of the asset you can risk given the stop-loss points and your risk amount.
Target Percent Remaining: Shows how much of your target is left to reach, based on the one-hour high price.
Table Display Logic:
This is the most important part of the indicator because it determines how the data is displayed on the chart in a table. Here's a breakdown:
Column and Row Setup:
Based on the display mode (Full or Mini), it adjusts the number of rows and columns in the table.
The columns display the types of data (e.g., "Max%", "05% +", "Burst Power", etc.), while the rows show the values of those parameters.
If "Show Latest Date" is enabled, an additional column will show the date of the last occurrence for each price move.
Burst Power and SL/Target Info:
The table displays the following information:
Max % Move: The largest price move observed.
Burst Power: A score indicating the strength of the price move (calculated from 5%, 10%, and 19% price moves).
SL Quantity: The quantity you can trade based on your risk and stop-loss.
Target % Left: The remaining percentage to reach the target price.
The table updates whenever the barstate is the last and the selected timeframe is active.
Table Position:
The table position is adjustable based on the inputs (top, middle, bottom), allowing you to control where the table appears on the screen.
Changes Made for Timeframe Flexibility:
The table and all its calculations previously only displayed when the chart was in a daily timeframe (timeframe.isdaily). This behavior has been removed.
No Timeframe Dependency: The table now displays regardless of which timeframe you are viewing. If you switch to another timeframe (e.g., 15-minute, 1-hour), the table will still appear without needing to be modified. The table will display in all timeframes you choose.
How to Use:
Install the Script: Add this script to your chart in TradingView as a custom indicator.
Customize Settings: Use the inputs in the settings panel to adjust your preferred values for lookback period, risk amount, SL percentage, target percentage, and other table display options.
Analyze the Data: Watch the table update with real-time data as you analyze price movements. The table will show the frequency and magnitude of price bursts, along with risk and target data to help you make better trading decisions.